7 Must-Know Excel Tips for Project Managers in 2025
You want your projects to go well, right? Excel Tips can help you work faster and better. Most project managers use Excel each day. Look at how many people use it:
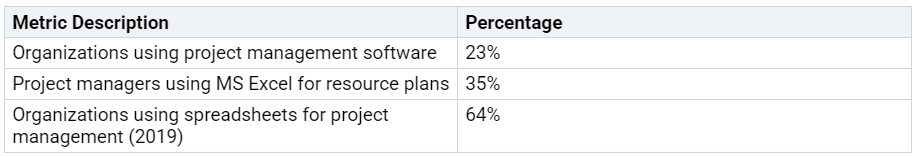
If you know Excel well, you can work with big data. You can make math work automatic. You can find mistakes before they cause problems. You get better at watching budgets, time, and resources. Employers want people with Excel skills. These skills help you make good choices and save time.
Key Takeaways
Use conditional formatting to see task status fast. Colors and icons help you spot deadlines.
Pivot tables let you look at project data quickly. They show important numbers in a clear way.
Drop-down menus help keep project updates the same. They lower mistakes by giving fewer choices.
Excel Tables and Dynamic Arrays update your data by themselves. This saves time and stops errors.
Filters and keyboard shortcuts help you find things fast. They make your work easier and quicker.
1. Conditional Formatting
Visual Status Tracking
Conditional formatting in Excel helps you make your data colorful. You can see problems and track progress fast. It shows what needs your attention right away. Your project sheet looks lively when you use it. You do not need to search for overdue tasks. You do not have to guess which items are most important.
Here are ways to use conditional formatting for status tracking:
Color scales: Pick colors for tasks like Pending, In Progress, or Completed. Red means Pending. Yellow means In Progress. Green means Completed.
Icon sets: Put icons such as check marks, flags, or arrows. These show priority or milestone status.
Data bars: Use colored bars to show how much budget or resources you used.
Kanban-style boards: Mix formulas and color coding. This makes a board that updates when you change task status.
RACI matrices: Color-code who is Responsible, Accountable, Consulted, or Informed.
Tip: To use conditional formatting, select your data. Click the "Conditional Formatting" button on the Home tab. Pick a rule. Try "New Rule" for more choices.
Highlight Deadlines
Deadlines can come up fast. Conditional formatting helps you notice them. Excel can highlight due dates that are soon or overdue. This helps you and your team focus on important tasks.
Use a bright color for tasks due next week.
Use formulas to color whole rows when a deadline is close.
Make overdue tasks easy to spot with bold red shading.
Project tracking templates use these tricks to help everyone stay on track. When you see urgent tasks in a new color, you know what to do first. This helps your team meet deadlines and avoid stress at the last minute.
Quick How-To:
Select your date column. Go to "Conditional Formatting," then "New Rule," then "Use a formula to determine which cells to format." Type a formula like=AND(A2>=TODAY(),A2<=TODAY()+7)
to highlight tasks due in the next 7 days. Pick a color and click OK. Now, your deadlines stand out!
2. Pivot Tables
Data Summarization
Pivot tables in Excel help you turn messy project data into clear summaries. You can see totals, averages, and counts with just a few clicks. If you have a long list of tasks, pivot tables let you group them by team member, status, or deadline. You do not need to scroll through hundreds of rows. You get answers fast.
Here’s how you can use pivot tables to summarize your project data:
Organize your data in a table. Make sure each column has a clear header, like “Task Name,” “Assignee,” or “Status.”
Format your data as an Excel table. This keeps your pivot table updated when you add new tasks.
Keep each column consistent. Dates should look like dates. Numbers should have the right format.
Separate categories (like “Department”) from numbers (like “Hours Spent”).
Add formulas to your data before you build your pivot table. This helps you track things like overdue tasks or budget spent.
Tip: Use Excel’s “Recommended PivotTable” feature if you’re new. It gives you a quick starting point.
You can summarize tasks by assignee to see who has the most work. You can count tasks by status to check how many are completed or pending. Pivot tables make it easy to spot trends and gaps.
Project Analysis
Pivot tables help you analyze your project from different angles. You can group tasks by month, quarter, or year. You can filter by team, priority, or deadline. This helps you focus on what matters most.
Key metrics you can track with pivot tables include:
Status of subgoals
Time spent on each phase
Resource allocation
You can also use conditional formatting in your pivot table to highlight important numbers. For example, you can color cells that show overdue tasks or budget overruns.
Quick How-To:
Select your project data. Go to the “Insert” tab and click “PivotTable.” Choose where you want the table to appear. Drag fields into Rows, Columns, and Values to build your report. Use filters to focus on specific teams or dates. Refresh your pivot table after updating your data to keep your analysis current.
Pivot tables give you a clear view of your project. You can make better decisions and keep your team on track.
3. Excel Tips: Drop-Down Menus
Standardize Updates
You want your project updates to look the same every time. Drop-down menus in Excel make this easy. When you use drop-downs, you give your team a set list of choices. No one can type in their own version of "In Progress" or "Done." This keeps your project sheet neat and clear.
A study in healthcare showed that adding drop-down menus to forms helped everyone enter information the same way. The team used a new template with drop-downs for common choices. This made their records more accurate and easier to read. You can use the same idea for your project status updates. When everyone picks from the same list, you avoid mistakes and confusion.
Here’s how drop-down menus help you:
They stop people from typing different versions of the same word.
They make sure everyone uses the same status labels.
They help you spot updates fast because the words always look the same.
Improve Clarity
Drop-down menus do more than just keep things tidy. They also make your project tracking easier to understand. When you look at your Excel sheet, you see clear, simple choices. You do not have to guess what someone meant by a strange status.
Drop-down lists in Excel also boost accuracy. They let you control what people can pick, so you avoid errors. You can even set up dynamic lists that change based on other choices. This makes your project sheet smarter and faster to use.
Tip: To add a drop-down menu, select the cells you want. Go to the "Data" tab, then click "Data Validation." Choose "List" and type your options, like "Not Started, In Progress, Completed." Click OK. Now, your team can only pick from your list!
Using drop-down menus is one of the best Excel Tips for project managers. You save time, reduce mistakes, and make your project tracking clear for everyone.
4. Excel Tables & Dynamic Arrays
Automatic Updates
Do you want your project data to update by itself? Excel Tables and Dynamic Arrays can do this for you. Experts say these tools save time and help you make fewer mistakes. When you change your data into a table, Excel does things like update formulas and charts for you. Dynamic Arrays let you use new formulas that fill in answers on their own. You spend less time fixing problems and more time leading your team.
Here are ways you can use these features for automatic updates:
Change your data into an Excel Table. This lets Excel grow your table when you add new tasks or costs.
Use dynamic array functions like
SORT
andUNIQUE
. These update your lists as soon as your data changes.Make drop-down lists that change with your project year or phase.
Link your data to other sources with Power Query. Your numbers refresh without you doing anything.
Connect your charts to these tables. Your visuals update as soon as your data does.
Tip: To make a table, select your data and press
Easier Data Management
It is much easier to handle project timelines or budgets with Excel Tables. You can build a Gantt chart or a budget tracker that grows as your project grows. For example, when you add a new task, your timeline updates by itself. You do not need to rewrite formulas or fix charts.
Dynamic Arrays help you filter, sort, and sum up your data with just one formula. You can see unique team members or sort tasks by deadline in seconds. This means less work for you and fewer mistakes.
But be careful of common mistakes! Project managers often see errors like #SPILL!, #REF!, or #NAME? when using these tools. Look at this table for quick help:
Using Excel Tables and Dynamic Arrays helps you keep your project data neat, current, and simple to handle. You get more done with less work!
5. Consistent Layouts
Organized Worksheets
You want your Excel sheets to make sense at a glance. A clear and consistent layout helps you and your team find what you need fast. When you organize your worksheets, you cut down on confusion and mistakes. You also make it easier for everyone to stay on the same page.
Here are some best practices for keeping your worksheets organized:
Keep it simple. Remove extra data and fancy formatting. Less clutter means less stress.
Use cell styles. Mark input cells, calculation cells, and headings with different colors or styles. This helps everyone know where to look and what to edit.
Add a legend. Place a small guide on your first sheet. Explain what each color or style means.
Hide gridlines. Your sheet looks cleaner and more professional without them.
Stick to the same fonts and colors. Use the same style for every sheet. This makes your workbook look sharp and easy to read.
Separate your data. Put tasks, timelines, and budgets on different tabs. This keeps things tidy.
Plan for the future. Avoid hard-coded numbers. Build your sheet so you can update it as your project grows.
Tip: Start with a project management template. Set up your headings, color codes, and tabs before you add any data. Save this as your master copy. You can reuse it for every new project!
Readable Tracking
A consistent layout does more than look good. It helps you track your project with less effort. When you use the same format for every project, you spot problems faster. You also help your team know what to do next.
Clear headings and labels make it easy to find tasks, deadlines, and who is responsible.
Using the same colors and fonts helps everyone read your sheet quickly.
Visual tools like charts and data bars show progress at a glance.
Custom templates let you adjust for each project but keep the same easy-to-read style.
When you use a consistent layout, you boost teamwork. Everyone knows where to look for updates. You avoid delays and misunderstandings. Your Excel sheets become a tool for better communication and smoother projects.
6. Filters
Quick Sorting
You probably have a long list of tasks in your project sheet. Filters in Excel help you find what you need fast. You do not have to scroll through hundreds of rows. With just a few clicks, you can sort and see only the tasks that matter right now.
Here’s how filters save you time and keep you organized:
You focus on one part of your project without searching through everything.
You create quick reports for meetings or updates.
You spend less time looking for information.
You stay organized, even with many projects at once.
Tip: To add a filter, select your header row and press Ctrl + Shift + L. Little arrows will appear. Click an arrow to sort or filter your data.
You can use filters for text, numbers, dates, or even colors. For example, you might want to see only tasks marked "In Progress" or those due next week. Filters help you spot trends and keep your project on track.
Focused Views
Filters do more than just sort. They help you focus on the most important details. You can filter by assignee to see what each team member is working on. You can check overdue tasks or find out who has too much work.
You can use color filters to highlight urgent tasks.
Date filters let you see what’s due soon.
Number filters help you track hours or costs.
Project managers often use filters to:
Balance workloads by checking who has too many or too few tasks.
Spot bottlenecks by filtering tasks with long delays.
Note: Workers spend almost 20% of their week searching for information. Filters help you cut this wasted time. You get answers faster and make better decisions.
Filters also help your team work together. Everyone can focus on their own tasks or see the big picture. As your data changes, filters update in real time. This keeps your insights fresh and your project moving forward.
7. Excel Tips: Shortcuts
Faster Navigation
You want to move around your Excel sheet quickly, right? Shortcuts help you jump from one part of your project to another in seconds. You do not have to waste time clicking or scrolling. When you use keyboard shortcuts, you get to the data you need fast. This is one of the best Excel Tips for saving time every day.
Here’s a table of shortcuts that project managers use most for navigation and selection:
You can use these shortcuts to check tasks, budgets, or timelines without lifting your hands from the keyboard. You save time and keep your focus.
Tip: Try using Ctrl + Arrow keys to jump to the end of your task list. You’ll never scroll for ages again!
Efficient Editing
Editing your project sheet gets much easier with shortcuts. You can copy, paste, and fill cells in seconds. You also reduce mistakes because you do not click the wrong cell or lose track of your place. Regular use of shortcuts helps you work faster and more accurately.
Here are some editing and data management shortcuts you should know:
F2: Edit the active cell
Ctrl + C / Ctrl + X / Ctrl + V: Copy, cut, and paste
Ctrl + D: Fill down
Ctrl + R: Fill right
Ctrl + Shift + L: Add or remove filters
Alt + D + S: Sort data
Ctrl + Z / Ctrl + Y: Undo and redo
Ctrl + S: Save your workbook
Project managers who use these Excel Tips see real gains in speed and accuracy. You spend less time on repetitive clicks. You make fewer errors in your data. You also boost your workflow and keep your project on track.
Did you know? The London Olympics committee lost money because of a simple spreadsheet typo. Using shortcuts and validation tools helps you avoid costly mistakes.
If you want to get even better, share your favorite shortcuts with your team. Practice them often. You’ll see your productivity soar!
You can make project tracking and teamwork better with these Excel Tips. When you use these tips, you get:
Updates happen right away and you can work with others anywhere
Dashboards and reports are easy to read and help you track progress
You do not have to do as much work by hand because of automation and templates
It is simple to find problems early
Do you want to start quickly? Try free project management templates or add-ins like Project Plan and Lucidchart. Share your best tip below or sign up to get more project hacks!
FAQ
How do I quickly highlight overdue tasks in Excel?
You can use conditional formatting. Select your date column. Click "Conditional Formatting" on the Home tab. Choose a rule that highlights dates before today. Your overdue tasks will stand out in red or any color you pick.
What is the fastest way to filter tasks by team member?
Just press Ctrl + Shift + L to add filters. Click the arrow on the "Assignee" column. Pick the team member you want. Only their tasks will show up. You can switch filters anytime.
Can I create a project dashboard in Excel?
Yes! You can use tables, charts, and slicers. Build a summary sheet with key metrics. Add charts for progress and deadlines. Use slicers to filter data. Your dashboard updates as your data changes.
Why should I use drop-down menus for status updates?
Drop-down menus keep your sheet neat. Everyone picks from the same list. You avoid spelling mistakes and confusion. Your project tracking stays clear and easy to read.
What are the top Excel shortcuts for project managers?
Try these shortcuts to work faster every day!