


How to Combine Calculation Groups and Field Parameters in Power BI

In Power BI, using Calculation Groups with Field Parameters is helpful. These tools work together to make your data models better. Calculation Groups lower the number of measures you need. Field Parameters let you switch between metrics or dimensions easily. This mix makes your work faster and visuals more interactive. It also helps you create simple reports that fit changing business needs.
Key Takeaways
Calculation Groups make your data simpler by grouping similar measures. This reduces how many measures you need to make.
Field Parameters let users pick metrics or dimensions easily. This keeps reports clean without adding too many visuals.
Using both Calculation Groups and Field Parameters makes reports flexible. These reports can change to fit business needs and save time.
Name your Calculation Groups and Field Parameters clearly. This helps users understand and move through reports better.
Test your reports often to keep them fast and easy to use. This improves the overall experience for everyone.
Understanding Calculation Groups
What Are Calculation Groups?
Calculation Groups in Power BI help you organize your measures better. Instead of making a new measure for every calculation, you can group similar ones together. For example, you can put Year-to-Date (YTD), Month-to-Date (MTD), and Quarter-to-Date (QTD) in one group. This keeps your data model neat and makes it easier to use the same logic for many measures.
Tip: Think of Calculation Groups like a toolbox. Instead of carrying many tools, you have one set that works for different tasks.
Benefits of Using Calculation Groups
Using Calculation Groups has many benefits:
Simpler Data Models: Fewer measures make your model easier to use.
Uniform Calculations: The same logic applies to all your measures.
Saves Time: You spend less time creating and fixing measures.
These benefits make Calculation Groups a great tool for easier reporting.
How Calculation Groups Simplify Measure Management
Managing measures is easier with Calculation Groups. You don’t need to create separate measures for every situation. One group can handle all related measures. For example, if you want to check sales, profit, and discounts over time, one Calculation Group can do it. This saves time and reduces mistakes in your work.
With Calculation Groups, you can focus on understanding data, not fixing measures.
Exploring Field Parameters
What Are Field Parameters?
Field Parameters in Power BI help make reports more interactive. They let you switch between fields like measures or dimensions in one visual. For example, you can view sales, profit, or discounts without extra visuals. This feature gives you control over how data is shown.
Tip: Think of Field Parameters like a TV remote. You pick what to see with one click.
Field Parameters are great for letting users customize their view. Instead of setting fixed fields, users can choose what’s important to them.
Benefits of Field Parameters in Dynamic Reporting
Field Parameters have many advantages:
Flexibility: Switch between metrics or dimensions without extra visuals.
Customization: Users adjust reports to fit their needs easily.
Efficiency: Fewer visuals and measures keep reports simple and tidy.
These features make Field Parameters perfect for creating user-friendly reports.
How Field Parameters Enhance Report Interactivity
Field Parameters make reports more fun and interactive. Users can explore data in different ways without needing extra visuals. For example, a manager can check revenue, profit, or discounts in one chart. This keeps users interested and helps them find insights faster.
With Field Parameters, users explore data their way. Reports become both useful and enjoyable.
By adding flexibility and interactivity, Field Parameters turn plain reports into helpful tools for decisions.
The Synergy of Combining Calculation Groups and Field Parameters
Why Combine These Features?
Using Calculation Groups with Field Parameters makes reporting much better. Calculation Groups help manage measures easily, while Field Parameters make visuals flexible. Together, they create reports that adjust to business changes.
When combined, you can switch between metrics and dimensions smoothly. You also apply the same calculations across your data. For example, you can check sales, profit, and discounts over time without making extra measures or visuals. This saves time and effort in keeping your data model simple.
Note: Combining these tools lets you focus on finding insights, not fixing models.
Key Advantages of Using Them Together
Using Calculation Groups and Field Parameters together has big benefits:
More Flexibility: Switch between metrics and dimensions in one visual. Apply the same calculations to all measures.
Better Efficiency: Fewer measures and visuals make reports easier to handle.
Scalable Reports: Handle large datasets and complex setups with ease.
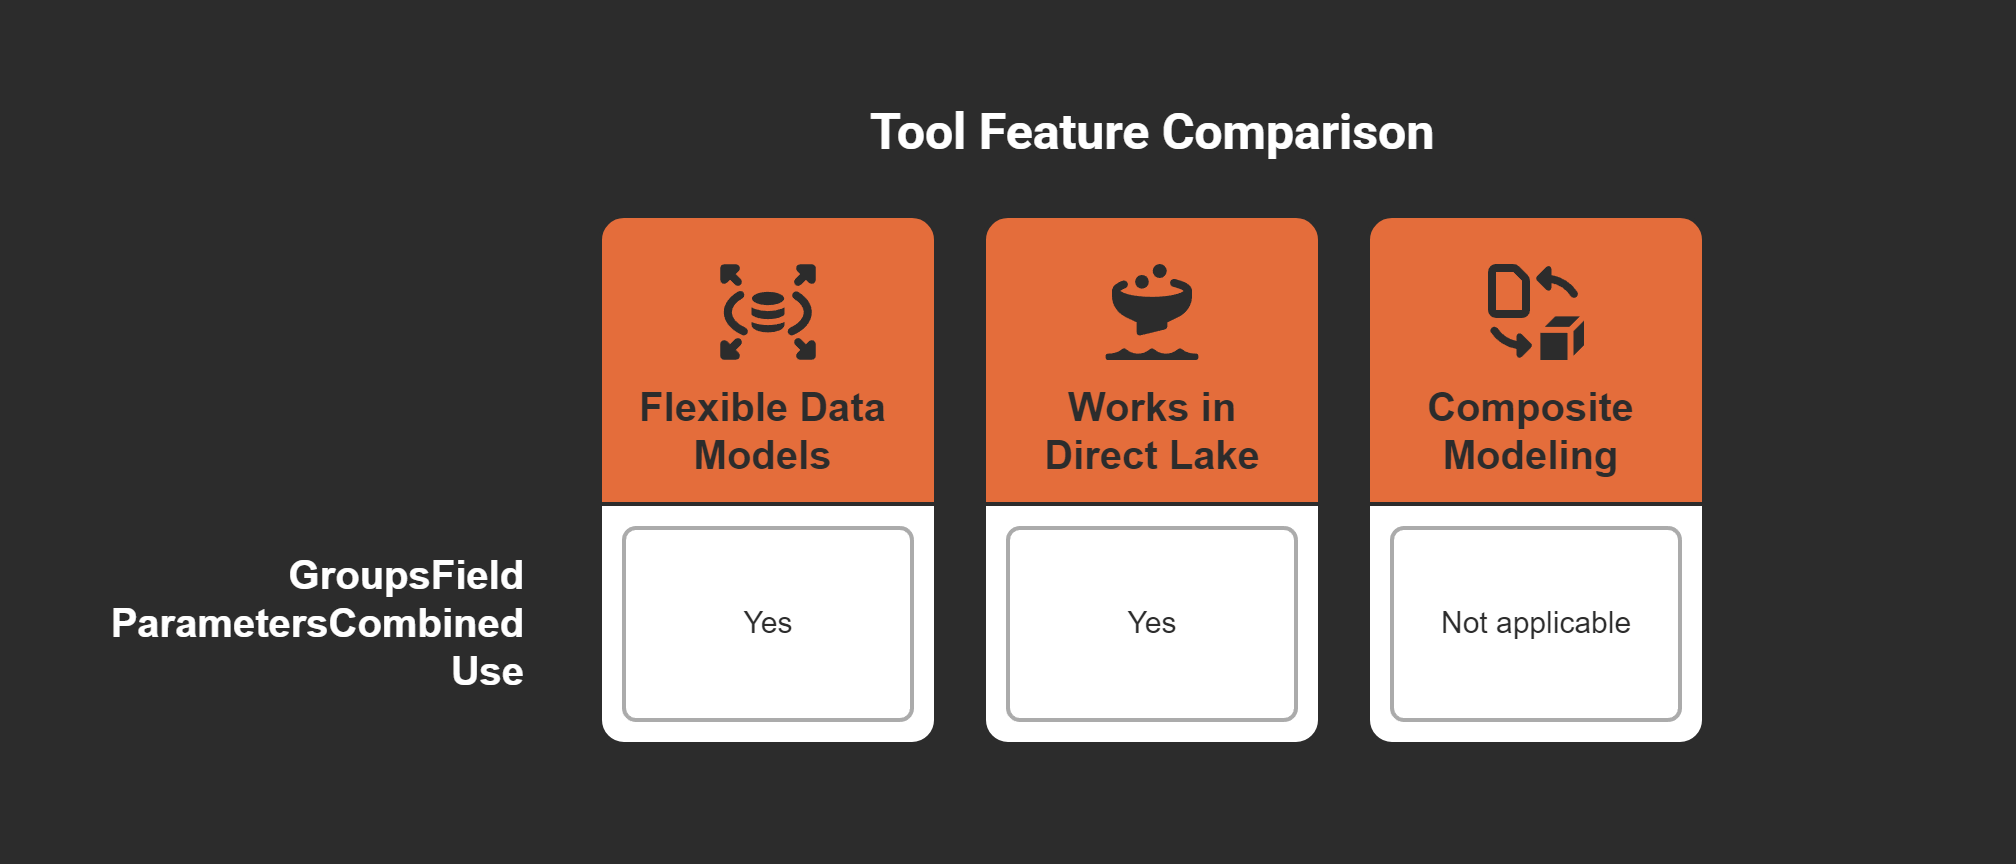
The table below shows how these tools work well together:
This teamwork keeps reports flexible and ready for growing data.
How This Combination Reduces Complexity in Data Models
Using Calculation Groups and Field Parameters makes data models simpler. Calculation Groups group similar measures, while Field Parameters let users switch fields in one visual.
For example, instead of making separate measures for Year-to-Date (YTD), Month-to-Date (MTD), and Quarter-to-Date (QTD) sales, you can use one Calculation Group for all. Then, Field Parameters let you choose between sales, profit, or discounts in one chart. This reduces extra work and keeps your model clean.
With these tools, reports are easy to manage and full of insights.
By cutting down complexity, you can spend more time analyzing data. This makes reporting faster and more useful.
Step-by-Step Guide to Combining Calculation Groups and Field Parameters
Setting Up Calculation Groups in Power BI
To begin, you need to make Calculation Groups in Power BI. These groups help organize and reuse calculations in your data. Follow these simple steps:
Enable Tabular Editor: Open Power BI Desktop. Make sure Tabular Editor is installed. This tool is needed to create Calculation Groups.
Go to Model View: In Power BI Desktop, open the Model view. Right-click on the table where you want the Calculation Group.
Create a New Group: Choose "Create Calculation Group" from the menu. Name it based on its purpose, like "Time Intelligence."
Add Calculation Items: Add items such as Year-to-Date (YTD) or Month-to-Date (MTD). Use DAX formulas to set the logic for each item.
Save and Refresh: Save your work in Tabular Editor. Go back to Power BI Desktop and refresh the model to see the new group.
Tip: Use clear names for your items. This helps others understand them when making reports.
Creating and Configuring Field Parameters
Field Parameters let you switch between fields in visuals. Here’s how to set them up:
Turn On Field Parameters: In Power BI Desktop, go to Options. Under Preview Features, turn on "Field Parameters" and restart Power BI.
Make a Field Parameter: In the Modeling tab, click "New Parameter" and pick "Fields." A setup box will appear.
Choose Fields: Add fields like Sales, Profit, or Discounts. Name the parameter, such as "Metrics Selector."
Edit the Parameter Table: Power BI makes a new table for the parameter. You can change the order or add descriptions for the fields.
Use the Parameter in a Visual: Drag the Field Parameter into a chart or table. Now users can switch between the fields you selected.
Note: Use Field Parameters to keep reports flexible without adding too many visuals.
The table below shows how Field Parameters improve reports with useful metrics:

Integrating Both Features in a Report
After setting up Calculation Groups and Field Parameters, combine them for a dynamic report. Here’s how:
Add Calculation Groups: Drag the Calculation Group into a chart, like a line graph. This applies calculations like YTD or MTD to your metrics.
Use Field Parameters: Add the Field Parameter to the same chart. This lets users switch between metrics, like Sales or Profit, while keeping the same calculations.
Test the Report: Try switching metrics and see if the calculations update correctly. Make sure both features work well together.
Organize the Layout: Arrange charts and slicers neatly. Add labels or tips to help users understand the report.
Publish the Report: When ready, publish the report to Power BI service. Share it with your team for feedback.
Pro Tip: Add slicers or buttons to make switching between metrics easier for users.
By combining these tools, you create reports that are simple yet powerful. Users can explore data in many ways without extra visuals or measures.
Testing and Improving the Combined Setup
After combining Calculation Groups and Field Parameters, testing is key. This ensures your report works well and is easy to use. Let’s look at how to test and improve it for the best results.
1. Check If the Report Works
Make sure everything in the report works as planned. Follow these steps:
Switch Metrics and Dimensions: Use the Field Parameter to change between sales, profit, or discounts. Check if visuals update correctly.
Use Calculation Groups: Test if calculations like Year-to-Date (YTD) or Month-to-Date (MTD) work for all metrics.
Test Interactivity: Click slicers, filters, and visuals. Make sure changes show up everywhere in the report.
Tip: Pretend you’re a user while testing. This helps find problems early.
2. Test How Fast the Report Is
Check how quickly your report loads and responds. Use Power BI’s Performance Analyzer to find slow parts. Focus on these areas:
Visual Load Time: See how long visuals take to appear. A good report should load visuals in under a second.
Data Model Speed: Check if Calculation Groups and Field Parameters cause delays.
For example, one report took 5 seconds to load. After fixing it, the load time dropped to 700 milliseconds. Another report with nine visuals loaded in just 33 milliseconds after changes.
3. Make the Data Model Better
A simple data model makes reports faster. Here’s how to improve it:
Remove Extra Measures: Use Calculation Groups to avoid duplicate measures. This keeps the model clean.
Use Fewer Visuals: Replace many visuals with one dynamic visual using Field Parameters. This reduces the report’s load.
Pre-Aggregate Data: Summarize data before bringing it into Power BI. This lowers the work Power BI has to do.
Pro Tip: Aim for visuals to load in less than half a second by improving the data model.
4. Get Feedback and Improve
After testing, share the report with a few users. Ask them about:
Ease of Use: Are Field Parameters easy to use? Can they switch metrics easily?
Speed: Does the report load fast? Are there delays when clicking visuals?
Insights: Does the report give useful information?
Use their feedback to make changes. Small fixes, like moving visuals or adjusting calculations, can make a big difference.
5. Watch Performance Over Time
After publishing, keep checking how the report performs. Look at:
What Users Do: See which metrics and calculations are used the most.
Speed Changes: Watch for slowdowns as the dataset grows. Update the model or visuals if needed.
By testing and improving regularly, your Power BI reports stay fast and easy to use. This makes your reports more valuable and builds trust with users.
A well-tested report saves time and gives better insights.
Real-World Use Cases for Combining Calculation Groups and Field Parameters
Dynamic Time Intelligence Reporting
You can make time-based reports using Calculation Groups and Field Parameters. These tools let you check data for periods like Year-to-Date (YTD), Month-to-Date (MTD), or Quarter-to-Date (QTD). Instead of creating separate measures, use one Calculation Group. Pair it with a Field Parameter to switch between metrics like sales, profit, or discounts.
For example, imagine comparing sales trends by months and quarters. This setup lets you easily switch between time periods and metrics in one chart. It helps you find patterns and trends faster.
Tip: Add slicers or buttons to make switching time periods easier.
Switching Between Key Metrics and Dimensions
Field Parameters let you change metrics or dimensions in one chart. When used with Calculation Groups, this feature becomes even better. You can apply the same calculations, like growth rates or totals, to all metrics.
For instance, you might want to study sales, profit, and discounts by region. Instead of making separate charts, use a Field Parameter to toggle between them. The Calculation Group ensures all metrics follow the same rules, keeping reports clear and consistent.
Pro Tip: Name your Field Parameters clearly so users know what they do.
Simplifying Complex Financial Reports
Financial reports often have many metrics and calculations. Combining Calculation Groups and Field Parameters makes these reports simpler. Group related calculations, like net income or gross profit, into one Calculation Group. Then, use a Field Parameter to let users explore metrics easily.
For example, a CFO might want to see net income trends or compare gross profit by department. With this setup, they can do both in one chart without extra visuals. This reduces clutter and makes financial reports easier to use.
A simple report saves time and helps leaders focus on insights.
Using Calculation Groups and Field Parameters together in Power BI changes reporting. It makes your data model simpler and cuts down extra measures. Reports become more interactive and flexible. You can easily switch between metrics and dimensions. At the same time, you keep calculations consistent across visuals.
Tip: Try these tools to make reports that are easy to use and adjust to business changes.
This combination saves time and makes work easier. It also helps you find insights faster for smarter decisions. Start using these features now to see how powerful they are!
FAQ
What are the main benefits of combining Calculation Groups and Field Parameters?
These tools make your data model simpler and easier to use. They cut down extra measures and make reports more interactive. You can switch metrics and keep calculations the same across visuals. This saves time and makes reports flexible for users.
Can I use Calculation Groups and Field Parameters in all Power BI visuals?
Yes, most visuals in Power BI work with these features. You can use them in charts, graphs, and tables. Just make sure your visuals allow field switching for the best experience.
Do I need advanced skills to use these features?
No, you don’t need to be an expert. Tools like Tabular Editor and Power BI’s Field Parameters make setup simple. Follow the steps in this blog to start using them easily.
How do Field Parameters improve report interactivity?
Field Parameters let users pick metrics or dimensions in one visual. This removes the need for extra visuals, keeping reports neat and fun to use. Users can explore data their way and find better insights.
Are Calculation Groups and Field Parameters suitable for large datasets?
Yes, they work great with big datasets. Calculation Groups reduce extra measures, keeping models efficient. Field Parameters cut down visuals, making reports faster and easier to scale.
Tip: Use Performance Analyzer often to check report speed and fix issues.