How You Can Use Microsoft Viva to Track Copilot Adoption and Success
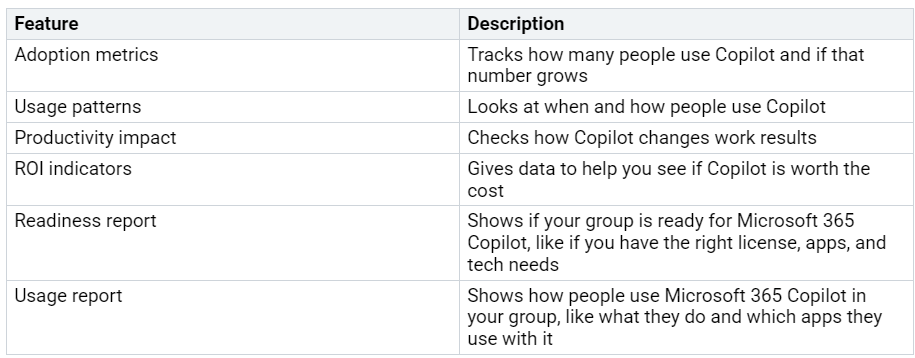
Tracking how your team uses Copilot helps you see its real value. Microsoft Viva puts data from the Copilot Dashboard and Admin Center together. You can check adoption rates, user activity, and changes in productivity all in one spot. Here is a quick look at the insights you get:
Key Takeaways
Use Microsoft Viva to see how your team uses Copilot. Look at how many people use it and what they do. This helps you know if it is helpful.
Set up your dashboard by connecting the Copilot Dashboard and Admin Center. This lets you get updates and see information right away.
Check how much people use Copilot and what they say about it. This helps you find patterns and see where your team needs help.
Send out surveys to get feedback from users. Use what you learn to make Copilot work better and make users happier.
Watch how many people use Copilot each month. Change your training and support plans using the data you find.
Microsoft Viva for Copilot Tracking
Analytics Overview
Microsoft Viva gives you a clear view of how your team uses Copilot. You can see important numbers and trends in one place. Start by opening the Microsoft Viva Insights app. Here, you will find analytics that show how many people use Copilot, how often they use it, and what features they like best. These numbers help you understand if Copilot is making a difference in your daily work.
You can use the analytics to spot patterns. For example, you might see that more people use Copilot after a training session. You can also check if certain teams use Copilot more than others. This helps you decide where to focus your support or training next.
Tip: Check the analytics every week. This helps you catch changes early and act fast.
Dashboard Integration
Microsoft Viva works with the Copilot Dashboard and the Admin Center. This means you get all your data in one place. To set this up, go to the Microsoft Viva admin settings. Connect your Copilot Dashboard and Admin Center accounts. Once you do this, you will see new charts and reports inside Microsoft Viva.
The dashboard shows you real-time updates. You can track adoption rates, see which apps people use with Copilot, and find out if your team meets the requirements for Copilot. The dashboard also lets you filter data by department or location. This makes it easy to find the information you need.
To get started:
Open Microsoft Viva.
Go to the Insights or Admin section.
Link your Copilot Dashboard and Admin Center.
Review the new reports and charts.
With these steps, you can use Microsoft Viva as your main hub for tracking Copilot adoption and success.
Key Features and Tools
Usage Metrics
You can see how your team uses Copilot with usage metrics in Microsoft Viva. These numbers show how many people use Copilot each day. They also show which features are used the most. You can watch for changes over time. For example, more people might use Copilot after training. These numbers help you find teams that need more help. You can also compare usage between departments. This helps you know where to give extra support.
Tip: Look at usage metrics every week to check your adoption goals.
Surveys and Feedback
Surveys and feedback tools help you learn how people feel about Copilot. You can send short surveys with Viva Pulse or the Copilot Impact Survey. These tools let you ask about how Copilot helps with work. You can get feedback right after someone uses Copilot. This gives you quick ideas about what works and what needs fixing.
Microsoft Viva keeps data private and follows rules when you collect feedback:
Feedback is only saved after the user clicks Submit in the feedback pane.
IT admins choose what data can be collected, which keeps user privacy safe.
Microsoft follows strict rules, so only allowed people can see feedback data.
Reporting Options
You have many ways to see and share your results. Microsoft Viva has reports that show adoption rates, usage patterns, and feedback. You can filter these reports by team, place, or time. This makes it easy to find what you need. You can also export reports to share with leaders or other teams.
New updates will make reporting even easier. Soon, you will see Copilot Analytics inside the Viva Insights web app. This will give you one place for all your Copilot reports and new ways to share them. These changes will help you track Copilot adoption and see how it helps your business.
Setup and Implementation
Access Requirements
Check your access before you start tracking Copilot adoption. Make sure your organization meets these rules:
Your group must have one premium Viva Learning license or a Viva Suite license to use all features.
You need admin rights to set up dashboards and surveys.
Tip: Ask your IT team to check your licenses and permissions first. This step helps you save time and stops setup problems.
Dashboard Setup
Setting up your dashboard lets you see all Copilot data together. Follow these steps to begin:
Open Microsoft Viva and go to the Admin Center.
Find the Copilot Dashboard area.
Connect your Copilot Dashboard and Admin Center accounts.
Pick the data you want to track, like adoption rates, usage patterns, and productivity impact.
Add filters for teams, departments, or places to make reports better.
You might face some problems during setup. Many groups worry about keeping data safe and private. You can fix these worries by using encryption, setting up access controls, and doing security checks often. If you find data mistakes, improve your data quality and ask team members to look at the results. Always use AI as a helper, not as a replacement for people.
Note: Check your technical setup. Make sure your IT systems can use the dashboard features. Upgrade your systems if you need to.
Survey Deployment
Surveys help you learn how people feel about Copilot. You can use Viva Pulse or the Copilot Impact Survey to get feedback. Here is how you send out surveys:
Go to the Viva Pulse section in Microsoft Viva.
Pick a survey template or make your own questions.
Choose the group or department you want to ask.
Set the survey for a time when users are active.
Send the survey and watch responses as they come in.
Keep surveys short and clear. Ask simple questions about how Copilot helps with work. Remind users their feedback is private and only shared with approved people. If few people answer, send reminders or give small rewards.
Tip: Use survey results to find trends and plan training. Share important findings with leaders to show Copilot’s value.
You may face problems like compliance risks or bias in feedback. Work with your legal team to follow all rules. Use different types of survey questions to get fair results. Save money by using only the features you need and checking your subscriptions often.
Data Interpretation
Adoption Trends
You can use adoption trend data to help plan your Copilot rollout. First, check how many people use Copilot each week. Watch if more people use it after training or campaigns. A table can help you match your goals with what you do:
You should also use the ADKAR model to guide your rollout:
Awareness
Desire
Knowledge
Ability
Reinforcement
Check these steps often. This helps you see where your team needs more help or training.
Tip: Look at adoption trends every month. Change your plan if some teams are not growing fast.
Sentiment Analysis
You can find out how people feel about Copilot by using built-in sentiment analysis tools. Viva Glint helps you know what employees think. Viva Pulse gives you quick feedback from teams and managers. These tools show if people feel good, neutral, or bad about Copilot.
Look for patterns in the feedback. If many people feel unsure, plan more training or share stories of success.
Actionable Insights
You can use feedback to make things better by using the right tools and questions. Simple feedback tools let managers get answers fast. Ask clear questions to learn what works and what needs fixing. Look at feedback quickly to find trends.
Note: Share what you learn with leaders. Show them how Copilot helps your team and where you can do better.
You can track Copilot adoption and success by following clear steps. Review your dashboards, send surveys, and study feedback often. Use the data to spot trends and make smart choices. Share results with your team. Keep improving your process.
Check your reports every week.
Ask for feedback after key changes.
Adjust your plan based on what you learn.
Use every tool at your disposal to get the best results.
FAQ
How do you access the Copilot Dashboard in Microsoft Viva?
You open Microsoft Viva, then go to the Admin Center. Find the Copilot Dashboard section. If you do not see it, check your permissions or ask your IT admin for access.
Can you export Copilot adoption reports for your team?
Yes, you can export reports from Microsoft Viva. Click the export button in the report view. Choose your format, such as Excel or PDF. Share these files with your team or leaders.
What should you do if survey response rates are low?
Send reminders to your team. Keep surveys short and clear. Offer small rewards or recognition for feedback. Explain why their input matters. This helps increase participation.
How often should you review Copilot usage data?
Check your data every week. Regular reviews help you spot trends early. You can adjust your training or support based on what you find.
Is user feedback in Viva surveys private?
Yes, Microsoft Viva keeps feedback private. Only approved people can see survey results. Microsoft follows strict privacy rules to protect user data.