Power BI vs Tableau Exploring Their Strengths and Weaknesses
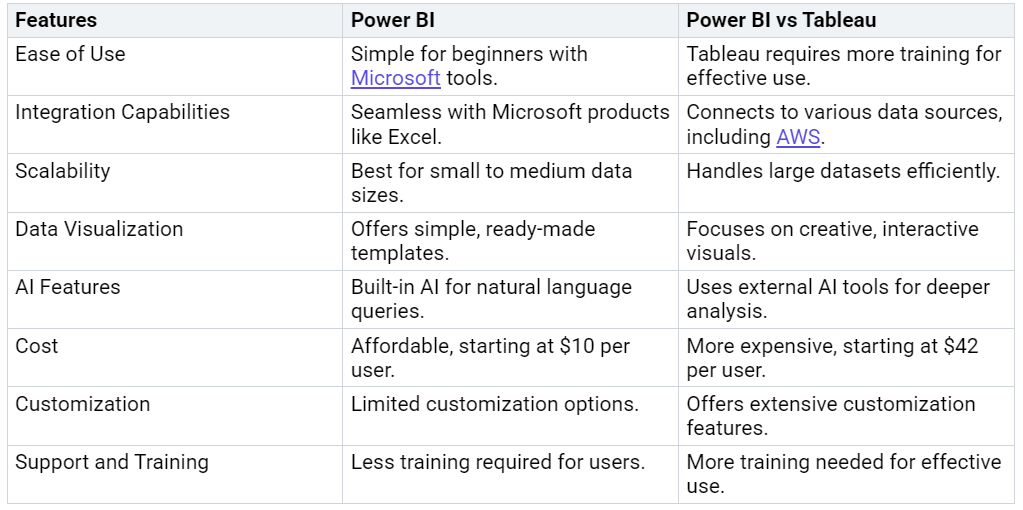
Comparing Key Features of Power BI and Tableau
Explore the strengths and weaknesses of Power BI and Tableau.
Choosing the best tool for business intelligence can change how you look at data and make choices. The right tool helps you find ideas that boost growth and save time. For example:
Stores using business intelligence (BI) tools to help customers have kept 27% more customers.
New BI tools can handle 40% of simple tasks, so you can work on bigger plans.
Power BI and Tableau are top tools in this area. Knowing their good and bad points will help you pick the one that fits your needs.
Key Takeaways
Power BI is easy to use and works well with Microsoft apps. It’s great for small and medium businesses.
Tableau is great at showing data in creative ways. Big companies and data science teams often use it.
Think about your budget: Power BI costs less, but Tableau has more advanced tools for a higher price.
Both have free versions. Test them to find the one that works best for you.
Pick Power BI for simple reports. Choose Tableau for exploring data and doing detailed analysis.

Enable 3rd party cookies or use another browser
Overview of Power BI and Tableau
Power BI: An Overview
Power BI is a tool made by Microsoft. It helps people study data and make simple reports. Over 100,000 businesses use it, and it has 30 million users. Power BI offers dashboards, charts, and tools to track important numbers, like sales or customer happiness.
You can connect data, like linking happy customers to higher sales. It also lets you break big numbers into smaller ones, like sales in different areas. These features make Power BI a favorite for businesses wanting better decisions through data.
Tableau: An Overview
Tableau is another top tool for business intelligence. It focuses on exploring data and telling stories with it. Tableau has over 100,000 users and a slightly bigger market share than Power BI at 16.99%. It’s great for making colorful charts and dashboards to find new ideas in data.
Tableau is growing fast. Its market is expected to grow from $1.15 billion in 2024 to $5.57 billion by 2037. This growth comes from more businesses needing tools to study customers. Small and medium businesses are using Tableau more, which adds to its success.
Tableau’s market may grow from $1.15 billion in 2024 to $5.57 billion by 2037.
This means it could grow 12.9% every year from 2025 to 2037.
More small and medium businesses are choosing Tableau, helping it grow.
Key Differences in Purpose
Power BI and Tableau are made for different reasons. Knowing this can help you pick the right one. Power BI is best for studying data and making reports. It works well for tracking numbers and creating detailed summaries. Tableau is better for exploring data and making it look interesting. It’s great for finding hidden patterns and making creative presentations.
Feature-by-Feature Comparison
Ease of Use: Power BI vs Tableau
Power BI and Tableau are easy to use in different ways. Power BI is simple for people who know Microsoft tools. It works well with Excel, making it beginner-friendly. Tableau has a more advanced design for expert users. But, learning Tableau takes more time and effort.
Did you know? About 29% of Tableau users need training to use it well. Only 25% of Power BI users report needing training. This shows Tableau is harder for beginners.
If you want something easy to learn, Power BI is better. If you can spend time learning, Tableau offers great visual tools.
Integration Capabilities: Power BI vs Tableau
Integration is important when picking a business tool. Power BI connects easily with Microsoft tools like Excel and Teams. This makes it great for companies using Microsoft products. Tableau connects to many data sources, like AWS and Google Cloud.
If your company uses Microsoft tools, Power BI is a good match. If you use many platforms, Tableau’s flexibility is better.
Scalability: Power BI vs Tableau
Scalability shows how tools handle growing data needs. Power BI works well with small and medium data sizes. But, it might need changes for very large data. Tableau is made for big data and works smoothly with it. Its strong engine handles tough tasks easily.
For small data, Power BI is affordable and works well. For big data, Tableau is the better choice.
Data Visualization: Power BI vs Tableau
Showing data visually is key for business tools. Both Power BI and Tableau are great at this but serve different purposes. Power BI keeps things simple and easy to use. It has ready-made templates and drag-and-drop tools. These help you quickly make charts like bar graphs, pie charts, or heatmaps. You can use them to check sales or customer happiness.
Tableau focuses more on creativity and exploring data. It lets you find hidden patterns with advanced visuals. You can make interactive dashboards with animations and filters. Tableau works well with complex data, making it perfect for storytelling with numbers.
If you want quick and simple visuals, choose Power BI. If you need detailed and creative presentations, go with Tableau.
AI and Advanced Analytics: Power BI vs Tableau
AI and smart tools are changing how we study data. Power BI has built-in AI features like asking questions in plain English. For example, you can ask, "What were last month's sales?" and get answers fast. It also predicts trends using machine learning, helping you plan ahead.
Tableau uses AI differently. Its "Explain Data" tool finds patterns and oddities in your data. It also connects with outside AI tools for deeper analysis.
Tip: Power BI’s AI tools are easy for beginners to use. Tableau needs more setup but offers advanced options for experts.
Power BI is simpler for everyday users. Tableau is better for experts who need advanced tools.
Cost and Pricing: Power BI vs Tableau
Cost is important when picking a business tool. Power BI is cheaper, making it good for small businesses. Its Pro plan costs $10 per user each month. The Premium plan starts at $20. There’s also a free version for basic tasks.
Tableau is more expensive and aimed at big companies. Its Creator plan costs $75 per user each month. The Explorer plan is $42. Tableau Public is free but has limits on sharing.
For 20 users, Power BI Pro costs $2,400 yearly. Tableau Creator costs $5,892. For 100 users, Power BI costs $12,000, while Tableau costs $29,460.
Both tools have free versions to try. Power BI doesn’t need email signup, but Tableau gives a 14-day trial.
Advantages and Disadvantages
Strengths of Power BI
Power BI is affordable and easy to use. It works well with Microsoft tools like Excel. This makes it great for businesses already using Microsoft products. Beginners can make reports and dashboards without much training.
Power BI is also budget-friendly. Its Pro plan costs $10 per user monthly. This makes it a good choice for small and medium businesses. It has built-in AI tools like natural language queries. You can ask questions in simple English and get quick answers.
This table shows Power BI’s strong market share and wide use. Many businesses trust it for their needs.
Weaknesses of Power BI
Power BI struggles with very large datasets. It can slow down when handling big or complex data. Fixing this may need extra setup. While it’s easy for beginners, advanced users might want more customization options.
Another issue is its focus on Microsoft tools. If your company uses other tools, connecting Power BI might be harder. These limits make it less ideal for businesses with diverse or huge data needs.
Strengths of Tableau
Tableau is great for working with complex data. It creates amazing visuals and interactive dashboards. Its drag-and-drop tools make exploring data simple. Tableau connects to many data sources like SQL databases and cloud services. This gives it flexibility.
Tableau’s real-time analysis and visuals are top-notch. It helps find hidden patterns in data. This makes decision-making faster and smarter.
Weaknesses of Tableau
Tableau is great for visuals, but it has downsides too. One big issue is its high cost. The Creator plan costs $75 per user each month. This can get expensive for small or medium businesses. Compared to tools like Power BI, Tableau is a bigger investment.
Learning Tableau can also be hard. Its features are powerful but need lots of training. Many users say it takes too much time to learn. If your team is new to these tools, it might slow them down.
Another problem is limited formatting options. Users often wish for more ways to customize reports. Tableau also doesn’t refresh reports automatically or handle versioning well. This can make it hard to keep data updated in busy workplaces.
Support services are not always reliable. Some users report poor IT help and security concerns. Backups are not done regularly, which could risk losing data.
Lastly, Tableau sometimes struggles with very large datasets. It works well with complex data but may slow down with huge amounts. This can make analyzing data less efficient.
If you care about cost, ease of use, and support, think carefully before choosing Tableau.
Use Case Recommendations
Power BI for Small and Medium Businesses
If you own a small or medium business, Power BI can help a lot. It’s affordable and easy to use, making it great for businesses with tight budgets. You can make useful dashboards and reports without needing special skills. Power BI works well with Microsoft tools like Excel, which many businesses already use. This makes it easier to learn and boosts productivity.
For example, one small factory using Power BI improved production by 15% and fixed problems 20% faster. Small stores have seen a 20% rise in sales and better inventory tracking. These examples show how Power BI helps businesses make smart decisions quickly.
Power BI also works well with large data, making it good for growing businesses. Its low-cost subscription plan gives great value without overspending.
Tableau for Large Enterprises
Big companies often deal with lots of data and need advanced tools. Tableau is perfect for this. It has a strong data engine and amazing visuals, making it great for handling big data and creating detailed dashboards. With its drag-and-drop tools, you can easily find patterns and trends to guide important decisions.
For example, Tableau’s Einstein Copilot improves data analysis and encourages better performance. Features like Recommended Questions and Guided Calculation Creation make it easier for non-experts to use. Tableau also works with R and Python, helping data science teams do advanced analysis.
Tableau also has advanced mapping tools and metadata features. These help manage big data and create visuals that support decisions for large companies.
Power BI for Budget-Conscious Organizations
If saving money is important, Power BI is a great choice. It costs just $9.99 per user each month, making it one of the cheapest tools available. The free version, Power BI Desktop, includes most features, so you can create dashboards and reports without spending anything.
Power BI works well with Microsoft tools, adding even more value. If your company already uses Excel or Teams, you can connect them to save time and money.
Power BI uses a low-cost subscription model.
Prices start at $9.99 per user/month, with discounts for bulk purchases.
Power BI Desktop is free and offers many features.
Integration with Microsoft tools lowers the need for extra software.
These cost-saving options make Power BI perfect for organizations that want powerful tools without spending too much.
Tableau for Data Science and Analytics Teams
If you're in data science or analytics, Tableau can change how you work. Its tools help teams explore, study, and share complex data easily. Tableau makes it simple to combine data, automate tasks, and create visuals that tell clear stories.
Easy Data Integration
Tableau connects to many data sources without trouble. It works with tools like Microsoft Access, Excel, SQL, and Salesforce. This saves time by removing the need for manual data transfers and reduces mistakes.
Faster ETL Processes
Preparing data often takes a lot of time. Tableau simplifies this with automated ETL (Extract, Transform, Load) tools. You can clean and organize data without needing to code. This lets you spend more time analyzing instead of preparing data.
Tip: Using Tableau for ETL tasks can save up to 50% of your time, letting you focus on insights.
Advanced Visuals for Better Understanding
Tableau turns raw data into easy-to-understand visuals. It guides you in making reports that are both clear and attractive. Use dashboards, heatmaps, or scatter plots to find trends and patterns. These visuals help explain your findings to others.
For example, if you're studying customer habits, Tableau can show buying trends or predict future actions. Its drag-and-drop tools make it easy for anyone to create professional visuals.
Why Analytics Teams Love Tableau
Tableau handles big data well and works with R and Python for advanced tasks. You can do predictive analysis, statistical modeling, or machine learning directly in Tableau or by linking other tools.
If your team needs flexibility, Tableau adapts to different workflows and data setups. It also has strong security features to protect sensitive data, which is important for industries like healthcare and finance.
Note: Tableau combines automation, visuals, and advanced tools, making it perfect for teams that need actionable insights.
Deciding between Power BI and Tableau depends on your business goals. Power BI is cheaper and works well with Microsoft tools. This makes it great for businesses wanting to save money. Tableau is better for creative visuals and flexibility. It’s perfect for big companies and data science teams.
Tip: Think about what matters most, like cost or visuals. Pick the tool that fits your business needs best.
FAQ
How are Power BI and Tableau different?
Power BI is cheaper and works well with Microsoft tools. This makes it great for small businesses. Tableau is better for showing data in creative ways and handling big data. It’s a good choice for large companies or data science teams. Pick based on your business size and goals.
Which tool is easier for beginners?
Power BI is simpler for beginners because it’s easy to use. It also connects well with Excel. Tableau has advanced features but takes more time to learn. If you’re just starting, Power BI is a good option.
Can both tools manage large data?
Tableau is better for big data because of its strong engine. Power BI works fine with small or medium data but needs tweaks for very large data. If your business uses a lot of data, Tableau might be the better pick.
Do Power BI and Tableau have free versions?
Yes, both tools offer free versions. Power BI Desktop is free and lets you make reports. Tableau Public is also free but has limits on sharing. Try both to see which one works best for you.
Which tool costs less?
Power BI is cheaper, starting at $10 per user each month. Tableau costs more, starting at $42 per user each month. If saving money is important, Power BI gives great value.