Step by Step Guide to Power BI Performance Tuning Using Aggregated Tables
If you want to maximize Power BI Performance with large datasets, aggregated tables offer a proven solution. By pre-summarizing your data, you can achieve dramatic improvements. For example, recent results show up to a 90% reduction in model size and a 10-20x speedup in report load times.
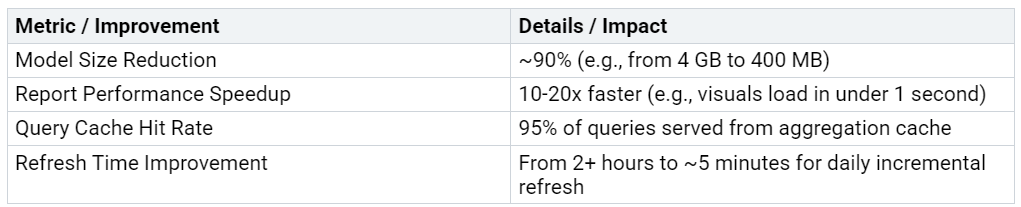
You will see how these gains translate into a smoother, lag-free user experience.
Key Takeaways
Aggregated tables speed up Power BI reports by storing pre-summarized data, reducing load times by up to 20 times and cutting model size by about 90%.
Choose the right method to create aggregated tables: Power Query for reusable ETL, DAX for flexible model-specific needs, and SQL for very large datasets and enterprise scenarios.
Configure aggregations carefully using the Manage Aggregations Dialog to map summary columns to detailed data, enabling Power BI to pick the fastest data source for queries.
Select the best storage mode—Import for speed, DirectQuery for real-time data, or Dual for a balance—to optimize performance and data freshness.
Test your aggregations for accuracy and speed using built-in tools, and follow best practices like hiding aggregated tables and matching data types to keep reports clean and fast.
Power BI Performance Basics
Aggregated Tables Overview
You often work with large datasets in Power BI. When you run reports on these datasets, the system must process millions or even billions of rows. This can slow down your dashboards and frustrate users. Aggregated tables solve this problem by storing pre-calculated summaries of your data. Instead of calculating totals or averages on the fly, Power BI retrieves these values directly from the aggregated tables.
Aggregated tables use common functions like SUM and COUNT. You can design them at the right level of detail, such as monthly sales or product category totals. This approach matches how users typically analyze data. You also gain flexibility by indexing and partitioning these tables, which further speeds up queries. Incremental updates keep your aggregated tables current without requiring a full refresh each time.
Tip: Aggregated tables form the backbone of many high-performing Power BI solutions. They reduce the complexity of queries and minimize the amount of data processed during report generation.
Why Aggregated Tables Matter
You want your reports to load quickly and deliver insights without delay. Power BI Performance depends on how efficiently the system retrieves and processes data. Aggregated tables play a key role here. By pre-aggregating data, you reduce the computational load on your reports. This leads to faster data retrieval and a smoother user experience.
Industry benchmarks show that using aggregated tables can cut query processing time by up to 80%. Real-time aggregation techniques can boost query responsiveness by 50-70%. These improvements translate into dashboards that update instantly and visuals that respond without lag. Aggregated tables also support advanced features like trend analysis, segmentation, and KPI tracking. You can monitor business objectives using KPI, gauge, and card visuals, all powered by clean, summarized data.
Aggregated tables provide a foundational boost to Power BI Performance. They work alongside other optimization methods, but they deliver the most significant gains when you deal with large or complex datasets.
Prerequisites
Tools and Permissions
Before you start tuning Power BI performance with aggregated tables, you need the right tools and permissions. You should have access to Power BI Desktop and, for advanced tasks, tools like SQL Server Management Studio (SSMS), DAX Studio, and Tabular Editor. These tools help you audit, validate, and tune your semantic models. You also benefit from using the Premium metrics app for monitoring capacity and Query Diagnostics in Power BI Desktop to analyze Power Query performance.
Note: Workspace roles such as Contributor, Member, or Admin determine your ability to create and manage aggregated tables. Build permissions control access to datasets, while tenant settings like "Allow XMLA endpoints" decide who can connect to semantic models using external tools.
You should also ensure your environment meets recommended system requirements:
Windows 10, 11 (64-bit), or Windows Server 2016 or later
Intel Core i5 or higher (minimum dual-core CPU)
16 GB RAM for large datasets (minimum 8 GB)
SSD storage with at least 10 GB free space
Display resolution of 1920x1080 or higher
Latest version of supported browsers (Chrome, Edge, Firefox, Safari)
Minimum 5 Mbps internet speed
For organizations using Power BI Premium or Embedded, configure capacity settings and size on-premises data gateways to handle expected workloads. Place data sources, gateways, and Power BI capacity in the same region to minimize network latency. Regularly monitor report performance to identify and resolve bottlenecks.
Data Model Preparation
A well-prepared data model forms the backbone of effective performance tuning. Start by collaborating with stakeholders to clarify business needs. This ensures your data model aligns with performance goals. Create a high-level conceptual model to map out entities and relationships. Move to logical modeling to define structures and constraints, which enforces data integrity and flexibility.
Follow these steps for robust data model preparation:
Profile your data to understand structure, volume, relationships, and quality.
Optimize queries by analyzing and tuning them, using caching and server-side views.
Continuously monitor system metrics, set alerts, and diagnose performance issues.
Use partitioning to manage large datasets efficiently.
Industry benchmarks show that starting with data model optimization before query tuning leads to better results. Testing with production-like data and documenting query patterns help you avoid common pitfalls, such as premature optimization or over-indexing.
By laying this groundwork, you set yourself up for successful Power BI performance tuning using aggregated tables.
Identify Aggregation Needs
Analyze Data Model
You need to start by examining your data model to determine where aggregation will have the most impact. Begin with simple statistics on your tables. Look at counts, minimums, maximums, averages, and medians for both categorical and numerical columns. This step helps you check data sanity and spot any anomalies, such as missing values or outliers. When you see columns with high cardinality—meaning they contain many unique values—you should consider whether aggregating or transforming these fields will simplify your model.
Tip: High-cardinality columns often slow down queries and increase memory usage. Aggregating these columns can streamline your reports and improve performance.
You should also review how users interact with your reports. If most queries do not require transaction-level detail, you can safely summarize data by key attributes like date, customer, or product. This approach reduces the number of rows and makes your model more efficient. Use tools such as DAX Studio or Power BI’s built-in performance analyzer to monitor query patterns and identify bottlenecks.
A structured approach to analyzing your data model includes:
Running basic statistics to understand data distribution.
Identifying columns with many unique values.
Reviewing query logs to see which tables and columns users access most.
Checking for data quality issues that may require cleaning or transformation.
Spot High-Volume Tables
You should focus on tables that contain the largest volumes of data. In Power BI, fact tables with tens or hundreds of millions of rows often become performance bottlenecks. For example, a table with over 10 million rows may take more than a minute to summarize if you do not use aggregation. When you introduce aggregated tables, you can reduce this time to less than a second.
A fact table with 250 million rows is a strong candidate for aggregation and DirectQuery. Loading such a large table into memory is impractical, and most reporting needs do not require every transaction. Instead, you can aggregate data by year, product, or other relevant dimensions. This strategy improves query speed and reduces memory usage.
Aggregating high-volume tables not only accelerates report loading but also helps you manage memory constraints in Power BI. You deliver faster insights and a better user experience by targeting these tables for aggregation.
Create Aggregated Tables
When you want to boost Power BI Performance, creating aggregated tables is a critical step. You have three main methods to choose from: Power Query, DAX, and SQL. Each method offers unique advantages and fits different scenarios. Selecting the right approach depends on your data architecture, refresh strategy, and performance needs.
Power Query Method
Power Query lets you build aggregated tables during the data preparation stage. You can use the "Group By" transformation to summarize data before it enters the Power BI model. This method works well for both Power BI Desktop and dataflows, making it suitable for reusable ETL processes.
How to create an aggregated table in Power Query:
Reference your main fact table.
Use the "Group By" feature to select grouping columns (such as Date, Customer, or Product).
Add aggregation operations like Sum, Count, or Average.
Load the resulting table into your model.
Tip: Power Query supports query folding, which means it can push aggregation logic back to the data source. This reduces the amount of data transferred and improves refresh times.
You benefit from Power Query’s automation and error reduction. Every transformation step is recorded, so you can reuse or modify your process easily. In practice, Power Query can complete tasks in minutes that might take hours with manual Excel formulas. It also compresses data efficiently. For example, a computed column in Power Query can use up to 75% less memory than a DAX calculated column on the same dataset. This leads to faster filtering, grouping, and aggregation.
Pros:
High reusability, especially with dataflows.
Efficient memory usage and compression.
Supports query folding for better performance.
Automation reduces manual errors.
Cons:
Limited to transformations supported by Power Query.
Some advanced aggregations may require custom M code.
DAX Method
DAX calculated tables allow you to create aggregations directly within the Power BI semantic model. You use functions like SUMMARIZE, SUMMARIZECOLUMNS, or GROUPBY to define the grouping and aggregation logic.
Example DAX formula:
SalesAggTable =
SUMMARIZE(
Sales,
Sales[OrderDate],
Sales[CustomerID],
Sales[ProductID],
"TotalSales", SUM(Sales[SalesAmount]),
"OrderCount", COUNTROWS(Sales)
)
DAX calculated tables refresh when you refresh your model. This method is flexible and works well for scenarios where you need to create aggregations based on existing model relationships or calculated columns.
You can validate your DAX aggregations using tools like DAX Studio. Case studies show that functions like CALCULATETABLE can consolidate queries, improving efficiency. However, the choice of DAX function affects both performance and correctness. SUMMARIZECOLUMNS is often preferred when you need to apply filters during aggregation.
Note: DAX calculated tables reside only within your Power BI model. You cannot reuse them outside the model or in other reports.
Pros:
Flexible and easy to implement for model-specific needs.
Supports dynamic aggregations and complex logic.
Integrates with existing relationships and calculated columns.
Cons:
Limited to the current Power BI model.
May use more memory than Power Query for large datasets.
Sequential processing can slow down refreshes with many calculated columns.
SQL Method
The SQL method involves creating aggregated tables or views directly in your data source. You use SQL aggregate functions like SUM, COUNT, and AVG to summarize data at the desired granularity. You can then import these tables into Power BI or connect using DirectQuery.
Example SQL query:
SELECT
OrderDate,
CustomerID,
ProductID,
SUM(SalesAmount) AS TotalSales,
COUNT(*) AS OrderCount
FROM
Sales
GROUP BY
OrderDate, CustomerID, ProductID
This approach works best for very large datasets. By aggregating data before it reaches Power BI, you reduce the volume of data transferred and processed. SQL-based aggregation is ideal when you need to optimize performance at the source, especially for composite models or DirectQuery scenarios.
SQL methods also support incremental refresh and data range parameters, which help manage large volumes efficiently. Query folding in Power Query can translate steps into native SQL, further improving performance.
Tip: Use SQL aggregation when you want to leverage database indexes, partitioning, or when your data warehouse team manages data preparation.
Pros:
Best for very large datasets and enterprise scenarios.
Aggregation happens before data enters Power BI, reducing load.
Supports advanced database features like indexing and partitioning.
Enables reuse across multiple reports and tools.
Cons:
Requires access to the data source and SQL skills.
Changes to aggregation logic may need database updates.
Not as flexible for ad-hoc or model-specific needs.
Choosing the Right Method
You should align your aggregation method with your data architecture and Power BI Performance goals. Use Power Query for reusable, automated ETL processes and efficient memory usage. Choose DAX for flexibility within the model and dynamic aggregations. Opt for SQL when working with massive datasets or when you need to optimize performance at the source.
Aggregated tables, regardless of creation method, form the backbone of Power BI Performance optimization. You can combine methods to match your data strategy and reporting needs.
Configure Aggregations
Manage Aggregations Dialog
You can unlock significant performance gains in Power BI by configuring aggregations correctly. The Manage Aggregations Dialog gives you a user-friendly interface to map your aggregated table columns to the detailed table columns. This mapping allows Power BI to decide, at runtime, whether to use the summary table or the detailed table for each query. As a result, you see faster report response times, especially when working with large datasets.
Aggregations reduce table sizes, which means Power BI processes less data and delivers results more quickly.
Dynamic query redirection lets Power BI choose the best table for each query, improving speed and efficiency.
Users often report "lightning-fast" response times when analyzing data at summary levels, even with tables containing hundreds of millions of rows.
Tip: When you use the Manage Aggregations Dialog, you also optimize data refresh operations. Smaller cache sizes and fewer DirectQuery requests help you balance performance and resource use.
To configure aggregations, follow these steps:
Open the Manage Aggregations Dialog from your aggregated table.
Map each aggregation column (such as "TotalSales") to its corresponding column in the detailed table.
Specify the aggregation type (for example, Sum, Count, or Min).
Save your configuration and validate the relationships.
This process ensures Power BI can automatically redirect queries to the most efficient table, reducing load and improving user experience.
Set Aggregation Functions
Choosing the right aggregation functions is crucial for both accuracy and performance. Power BI offers a range of functions, each suited for different scenarios:
SUM: Adds up values in a column. Use this for sales totals or revenue.
COUNT / COUNTA / DISTINCTCOUNT: Counts rows, non-blank values, or unique values. These help you track transactions or unique customers.
MIN / MAX: Finds the smallest or largest value in a column.
AVERAGE: Calculates the mean value, useful for metrics like average order size.
SUMX, AVERAGEX, MAXX, MINX: Iterator functions that evaluate expressions row by row before aggregating. These provide flexibility for advanced calculations.
Comparative analyses show that functions like SUMMARIZECOLUMNS efficiently summarize data with filters in a single query, making them ideal for filtered reports. CALCULATETABLE can combine queries for better efficiency and readability. However, using ADDCOLUMNS with SUMMARIZE may lead to multiple queries, which can slow down performance.
Note: Always match your aggregation function to your business question. Misunderstanding filter or row context can lead to incorrect results or slower reports.
By carefully configuring your aggregations and selecting the right functions, you ensure Power BI delivers fast, accurate, and insightful analytics—even with massive datasets.
Storage Modes
Choosing the right storage mode is essential for optimizing Power BI Performance, especially when working with aggregated tables. Each storage mode offers unique benefits and trade-offs that affect speed, flexibility, and data freshness.
Import
Import mode loads your data into Power BI’s in-memory engine. This approach delivers the fastest query performance because Power BI compresses and stores data locally. You can use all DAX functions and complex transformations. Import mode works best for scenarios where your data changes infrequently, such as monthly or weekly reports.
Import mode supports offline access and full feature compatibility. However, you must refresh your data regularly, and large datasets may hit memory limits.
DirectQuery
DirectQuery mode connects Power BI directly to your data source. You see real-time data, which is ideal for dashboards that require up-to-the-minute accuracy. However, query speed depends on the source system. Large or complex queries may run slower, and some DAX features are limited.
DirectQuery translates your report queries into SQL and sends them to the database.
Performance depends on the database’s speed and optimization.
You avoid memory constraints, but you may notice slower visuals and less interactivity.
For example, financial dashboards that track live stock prices often use DirectQuery. You get real-time updates, but you must ensure your database can handle the load.
Dual
Dual mode combines the strengths of Import and DirectQuery. You can set some tables to Dual, allowing Power BI to cache frequently used data while still accessing real-time data when needed. This setup works well in composite models, where you mix static historical data with dynamic, real-time information.
Dual mode supports efficient filtering and aggregations.
You balance speed and data freshness.
Composite models let you optimize performance by storing lookup tables in memory and keeping large fact tables in DirectQuery.
Many organizations use Dual mode for contextual tables, such as dates or products, to improve report responsiveness while maintaining real-time accuracy for transactional data.
Best Practices for Aggregation Tables:
Use Import mode for aggregated tables when possible to maximize speed.
Set lookup tables to Dual in composite models for efficient filtering.
Monitor query performance and adjust storage modes based on usage patterns.
Selecting the right storage mode directly impacts Power BI Performance. Import mode gives you speed, DirectQuery provides real-time data, and Dual mode offers a balanced approach for complex reporting needs.
Test Aggregations
Visual Validation
You need to confirm that your aggregated tables deliver accurate results and improve report usability. Start by comparing your report data against the original data sources. This helps you verify that totals, averages, and counts match expectations. Look for anomalies such as outliers or duplicate values. These issues can signal problems with your aggregation logic or data quality.
Check that all essential fields appear in your visuals.
Review summary metrics like sales totals or transaction counts for consistency.
Spot-check key visuals by filtering and slicing data to see if results update correctly.
Identify any missing or unexpected data points.
Automating these checks with BI testing tools or scripts reduces manual errors. You can also use sample data to validate Power Query steps and DAX calculations. When you involve users in acceptance testing, you ensure the dashboard meets their needs and delivers reliable insights.
Tip: Consistent values across datasets confirm data integrity. Automated validation helps maintain ongoing accuracy as your model evolves.
Performance Tools
Testing aggregations goes beyond accuracy. You also want to measure how much faster your reports run after optimization. Power BI provides several tools to help you track improvements.
You can use these tools to compare performance before and after aggregation. Benchmarks often show page load times dropping from 25 seconds to just 5 seconds. Users notice faster interactions and smoother filtering. Positive feedback and the ability to handle more complex analysis confirm that your Power BI Performance tuning efforts succeed.
Best Practices
Hide Aggregated Tables
You should always hide aggregated tables from report view after you configure them. This step keeps your data model clean and prevents users from accidentally using the wrong table in visuals. When you hide these tables, you reduce clutter and make it easier for users to find the right fields. Database best practices recommend hiding complexity behind views to simplify data retrieval. In Power BI, hiding aggregated tables helps you optimize report efficiency by reducing query complexity. Reports load faster and visuals respond more quickly because the model contains only the necessary tables and fields.
Reshaping your data into normalized, aggregated tables also reduces redundancy. Wide tables can slow down report loading and cause lagging visuals. By hiding unnecessary or auto-generated tables, you keep your model lean and responsive. This approach improves both performance and clarity, making your reports easier to maintain.
Tip: Hiding aggregated tables and removing unused columns can dramatically improve user interface speed and report clarity.
Data Types and Relationships
You need to ensure that data types match between your aggregated tables and related dimension tables. Mismatched data types can break relationships and cause errors in your reports. Always check that key columns, such as IDs or dates, use the same data type in both tables. This practice helps Power BI recognize relationships and apply aggregations correctly.
Establishing correct relationships is essential for accurate reporting. Connect your aggregated tables to the appropriate dimension tables before you use them in visuals. Use Power BI’s relationship view to verify connections and troubleshoot any issues. If you see unexpected results, review your relationships and data types first.
Note: Consistent data types and well-defined relationships are critical for reliable aggregations and smooth Power BI Performance.
Layered Aggregations
For complex models, consider using multiple layers of aggregation. Start by creating aggregated tables grouped by high-level attributes, such as category and date. Then, build additional tables at finer levels of detail if needed. This layered approach supports drill-down analysis and keeps queries efficient.
Performance testing shows that layered aggregations work well with DirectQuery datasets. You can combine Import and DirectQuery storage modes in composite models to balance speed and flexibility. Always configure storage modes and relationships carefully to ensure correct aggregation behavior.
Tip: Use layered aggregations to support both summary and detailed analysis without sacrificing report speed.
You now have a clear process for using aggregated tables to boost Power BI Performance. Start by identifying high-volume tables, then create and configure aggregations using Power Query, DAX, or SQL. Test your results and apply best practices to keep your reports fast and reliable. For advanced optimization, explore composite models and incremental refresh. Stay curious and keep refining your approach for even better results.
FAQ
What is the main benefit of using aggregated tables in Power BI?
Aggregated tables help you speed up report loading and reduce memory usage. You can deliver faster insights, especially when working with large datasets.
Can you update aggregated tables automatically?
Yes. You can schedule refreshes for aggregated tables. Power BI supports incremental refresh, which updates only new or changed data, saving time and resources.
Which method should you choose for creating aggregated tables?
Choose the method that fits your data architecture and performance needs.
Do aggregated tables affect data accuracy?
You maintain accuracy by mapping aggregated columns to detailed data. Always validate results after creating aggregations. Spot-check totals and averages to ensure your reports remain reliable.