Understanding the Impact of Power BI Metrics on Strategy
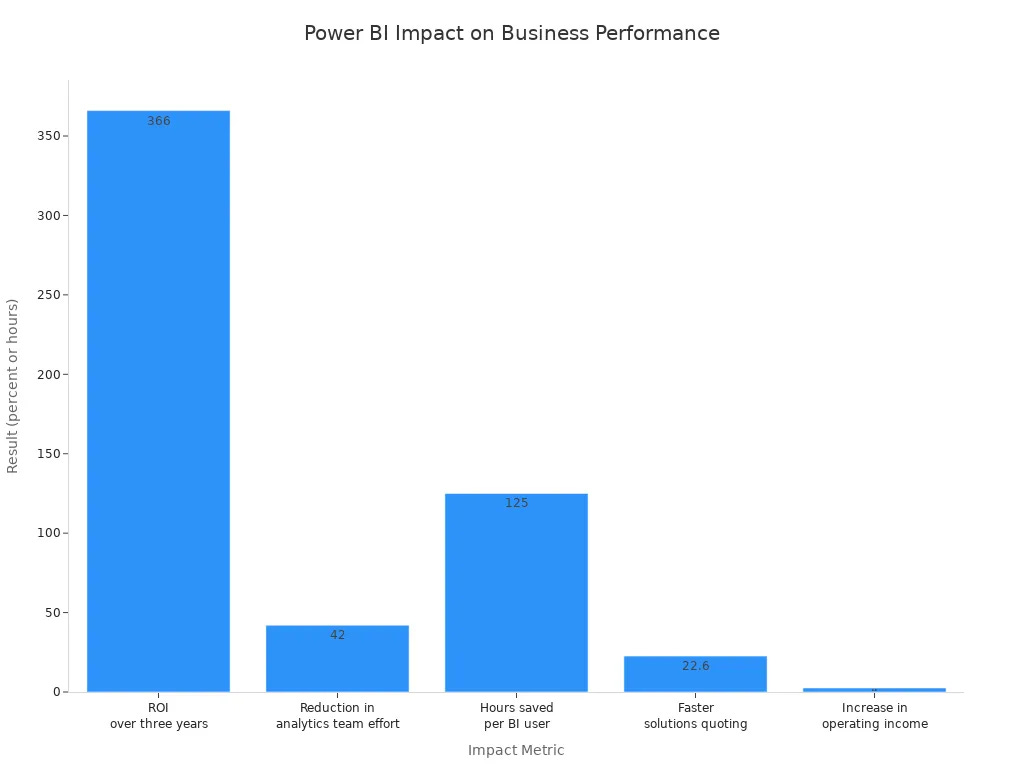
Power BI Metrics are very important for your business strategy. They give you information to help you make smart choices. Recent studies show big benefits from using these metrics. For example, businesses saw a 366% return on investment over three years. They also saved 125 hours for each BI user every year.
Key Takeaways
Power BI Metrics give important information. This helps businesses make smart choices and improve their plans.
Using Power BI can save a lot of time. It also makes reports more accurate. This lets teams work on important projects.
Updating dashboards and metrics often helps businesses stay on track. They can also change quickly when needed.
Defining Power BI Metrics
What are Metrics?
Metrics are measurable things that help you see how your business is doing. In Power BI, metrics are important signs of success. They help you check how close you are to your goals. By using Power BI Metrics, you can change raw data into useful information. This change helps you make smart choices based on current facts.
Here are some key parts that explain Power BI metrics in business intelligence:
Importance of Metrics
Knowing why metrics matter is key for checking performance. Power BI Metrics give you a way to measure success well. They help you spot trends, see progress, and make choices based on data. Here are some reasons why metrics are important:
Power BI lets you create interactive, real-time dashboards that give leaders quick insights into operations and KPIs, helping them decide faster.
Stakeholders get real-time access to unified data, which helps them make quick and confident decisions without waiting for old reports.
By automating reporting tasks, your team can cut down on mistakes and save time, allowing for more focus on strategic initiatives instead of regular data work.
Also, Power BI Metrics change raw data into useful insights. This ability improves your strategy and how you use resources. The platform's skill to provide up-to-the-minute data visualizations helps you react quickly to trends and chances.
Types of Power BI Metrics
Scorecards
Scorecards are strong tools in Power BI. They help you keep track of your organization's goals. They show how well you are doing compared to key performance indicators (KPIs). You can set goals and smaller goals, pick important KPIs, and check your progress often. This way, you can update your status based on what you see on your dashboard.
"True success is broader and more holistic than a single metric can adequately represent. While I believe that everything can be measured, I advocate that only certain, key measurements be used to most effectively drive alignment across large organizations."
Many companies, including Fortune 500 ones, use the Balanced Scorecard method. This method checks progress in four areas: financial measures, customer knowledge, internal processes, and learning/growth. By using Power BI to show balanced scorecard views, you can improve executive reporting and strategic management.
Here are some results from using scorecards in Power BI:
A retail chain raised revenue by 15% in one year by watching sales and fixing inventory problems.
A healthcare provider cut patient wait times and improved care, saving money.
A manufacturing company boosted production and product quality, greatly increasing profits.
Goals
Power BI Goals let you gather and view business metrics in one place. This feature helps you measure how close you are to your goals. By making scorecards that track different goals and assigning owners, you can keep an eye on your business's health.
Power BI lets you create reports that fit the needs of different departments. Custom dashboards make complex data easier to understand, helping teams track their goals. Collaboration features let you share and discuss performance metrics in real-time, keeping decisions aligned with your strategy.
Predictive analytics help you guess future performance using past data.
Trend analysis finds patterns that can help with strategic choices.
Machine learning reveals hidden chances, giving you an advantage.
Check-ins
Check-ins in Power BI help you watch your progress toward goals in real-time. You can make flexible scorecards to track important business metrics. The metrics in Power BI keep your data up-to-date, helping your teams focus on what matters.
Regular check-ins let you see how well you are doing with your goals. This practice helps you make smart choices and change strategies when needed.
Target and Current Values
Power BI metrics help you set your goals and track them against key business objectives. You can enter current and target values by hand or link them to data in existing Power BI reports. This flexibility helps you check if you are meeting your goals.
"With the Power BI Goals in place, Ram felt confident that his team was aligned and focused, paving the way for informed decisions that would drive Cellverse towards success."
By watching both target and current values, you learn about your performance and can make changes to stay on track.
Setting Up Power BI Metrics
Creating Dashboards
Making good dashboards in Power BI is important for tracking your metrics. Here are steps to set up your dashboards:
Do a needs assessment to find out what data insights you need.
Set clear business goals that match your overall strategy.
Make an implementation roadmap that shows stages and milestones.
Create data governance rules to keep data safe and accurate.
Involve stakeholders and give training to help your teams.
By following these steps, you can build dashboards that give useful insights into your business performance.
Data Visualization Techniques
Using the right data visualization techniques improves how you share your metrics. Here are some effective techniques to think about:
These techniques help you show data clearly and effectively. They let users explore data easily, making it simpler to understand complex information.
To keep your strategy aligned, update your dashboards regularly. For example, a financial health dashboard might check profitability and revenue growth every month. Keeping your metrics up-to-date helps you make smart decisions.
By using these best practices, you can improve your Power BI Metrics and boost your business strategy.
Power BI metrics can really help your business strategy. Here are some important benefits:
Operational Efficiency: Custom dashboards can make things 25% faster.
Decision-Making Speed: Predictive analytics can speed up decisions by 30%.
Report Accuracy: Regular updates can make reports 20% more accurate.
Use these tools to make smart choices and succeed in your strategy!
FAQ
What are Power BI Metrics?
Power BI Metrics are things you can measure. They help you see how well your business is doing and if you are reaching your goals.
How can I create effective dashboards in Power BI?
To make good dashboards, first check what data you need. Then, set clear goals and get input from others when designing them.
Why are metrics important for decision-making?
Metrics give you up-to-date information. This helps you make smart choices quickly and keep your actions in line with your business goals.