Unlocking Real-Time Value by Harnessing Data in Motion with Microsoft Fabric
You get real-time value when harnessing data in motion with Microsoft Fabric. Many companies now use real-time intelligence to help their business grow. Studies show that 80% of companies make more money when they use real-time data for smart decisions.
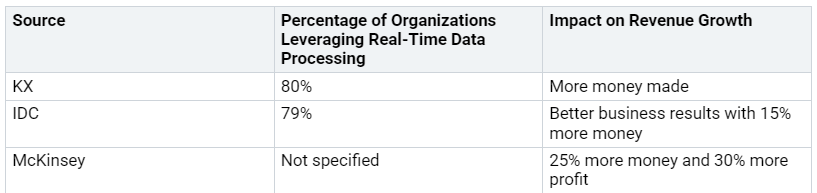
You can see that businesses are moving to event-driven systems. The chart below shows how many companies use central teams and event tools to manage events and get smart ideas.
Microsoft Fabric lets you add streaming data to ETL and monitoring. You get real-time intelligence, so you can act fast and make your business better. By harnessing data, you change how things work and find smart ideas you can use.
Key Takeaways
Use Microsoft Fabric to work with real-time data and help your business grow. Companies that use real-time information can make up to 80% more money.
The Real-Time Hub lets you get streaming data easily. This tool makes it simple to handle data and see results right away.
You can connect many types of data sources without trouble. Microsoft Fabric brings together cloud, on-premises, and third-party data. This gives you one clear view to help you make better choices.
Data Activator lets you automate actions when live events happen. You can set up triggers to make work easier and react fast to changes. You do not need to write any code.
Use KQL to make real-time dashboards. You can build moving charts that show instant results and help you watch important numbers closely.
Real-Time Hub in Microsoft Fabric
The Real-Time Hub in Microsoft Fabric is one main place for data in motion. You can handle live data streams and process events here. You get real-time intelligence without using many tools. This platform helps you use all your data. It is easy to capture, change, and study information as it moves through your business.
Streaming Data Management
Streaming data management is easier with the Real-Time Hub. The platform takes care of data from start to finish. You do not need to save data first. You can work with data streams right away. This method saves time and makes things simpler.
The Real-Time Hub puts Real-Time Analytics and Data Activator together. You get a simple setup that removes technical problems and helps work run better.
Here is a table that shows what makes the Real-Time Hub special:
You can pick low-code tools or use advanced code if you want. The Real-Time Hub works with many data sources. You can connect cloud, on-premises, and other systems easily. This helps you change fast as your business grows.
Immediate Data Access
With the Real-Time Hub, you get streaming data right away. You do not have to wait for batch jobs. You can see and use real-time intelligence as soon as events happen. This helps you make quick choices and react to changes.
The Real-Time Hub is the main spot for all streaming data. You do not need to look in many places. You can capture and change real-time events with no code. You can also send data using filters without writing code. Automatic indexing and splitting by time make searches faster. You can run hard analytics on lots of data and get answers fast.
Event-driven architecture is important for big companies. The Real-Time Hub is the first stop for your event pipeline. It separates event makers from users, so your system is more flexible and can grow.
Here is a table that compares how unified streaming data management helps work run better:
You can grow your data streams to handle lots of events. The platform keeps working even if something goes wrong. Your business can trust the data flow and real-time intelligence. Security features like private endpoints and safe spaces keep your data safe.
By using data in motion with Microsoft Fabric, you get a strong advantage. You can watch all your data, automate actions, and use business intelligence for every event.
Harnessing Data Integration for Real-Time Insights
Connecting Diverse Data Sources
You can get real-time intelligence by using data from many places. Microsoft Fabric lets you connect cloud, on-premises, and third-party data sources. You do not have to worry about where your data is stored. The platform brings all your data together. This makes it easy to see everything at once and get real-time insights.
Microsoft Fabric uses connectors to pull data from SQL and NoSQL databases, cloud storage, and custom APIs. You can also connect to business tools like Salesforce and SharePoint. The table below shows some common data sources and how you can connect them:
You get one view of all your business data. Microsoft Purview helps you keep your data safe and follow rules. You can see all your data, no matter where it comes from. This helps you find answers and make smart choices.
Tip: Microsoft Fabric brings together data from different places. You get real-time access and analysis. This helps you make decisions faster.
You can use built-in connectors to bring in streaming data from many platforms. This helps you react to changes in your business right away. You do not need to wait for batch jobs or manual updates.
Reliable Data Ingestion
You need reliable data ingestion to get real-time intelligence. Microsoft Fabric gives you many ways to bring in data. You can pick what works best for your business. You can use Eventstream, Real-Time Hub, or Data Activator for streaming data.
The medallion architecture in Microsoft Fabric helps you organize your data for real-time ETL. You start with the Bronze layer for bringing in data. Then you move to Silver for cleaning it. You finish with Gold for insights you can use. This setup gives you fast results and keeps your data ready. You can use Eventstream, KQL DB, and Power BI DirectLake to see your data quickly.
The Medallion Architecture helps you bring in, clean, and see streaming data.
You get insights that save money and work for big groups.
You can use data for business intelligence as soon as it arrives.
You must keep your data safe and correct. Microsoft Fabric uses data encryption and identity management to protect important information. You can label data with tags like "Confidential" or "Public." The platform checks data quality and tracks every step during ingestion. You can follow rules like GDPR and HIPAA.
Note: Microsoft Purview shows you where your data comes from and how it moves.
Here are some ways organizations keep data ingestion reliable:
Data encryption keeps information safe while moving and stored.
Identity and access management controls who can see and use data.
Compliance and governance help your business follow legal rules.
Data validation and auditing check data quality and track changes.
You can pick from many data ingestion options to fit your needs.
Use Cases for Data Integration in Microsoft Fabric
You can see how using data and real-time intelligence helps many industries. Microsoft Fabric helps businesses use streaming data for quick answers and better choices. Here are some real-world examples:
Businesses in finance and retail use Microsoft Fabric’s real-time analytics to work better and help customers fast. You can handle streaming data for big groups and get answers that help your business grow.
Callout: You can use data from many places, connect it easily, and get real-time intelligence for every part of your business.
Real-Time Data Processing and Visualization
Eventstream Transformation
You can use Eventstream transformation in Microsoft Fabric to get real-time intelligence. This tool helps you change streaming data as it comes in. You can filter events and manage fields easily. You can join data from different sources. You can also group and add up events for better business insights.
Here is a table that shows the main transformation features in Eventstream:
You make your data better and more accurate with real-time enrichment. You can act on new information right away. This helps you make faster choices. Many companies save money and grow when they use these tools. You can react to market changes quickly and keep your business ahead.
You get low wait times and strong performance with Microsoft Fabric. You can study complex business data in seconds. Your intelligence stays fresh.
Microsoft Fabric gives you low wait streaming and query tools.
You get strong performance and current analytics.
You can find business insights in seconds.
KQL Visualization
You can use KQL to make real-time dashboards and see streaming data. KQL connects to live data and lets you build dashboards for instant insights. You use simple queries to interact with your data and see trends as they happen.
To get the best from your dashboard, follow these tips:
Use KQL queries to make dashboard tiles.
Set up your dashboard for real-time data views.
Use base queries for better KQL speed.
Turn on auto-refresh for live updates.
Set real-time alerts to watch key numbers.
You can watch all your data with real-time dashboards and alerts. Microsoft Fabric lets you filter and enrich events, store data for fast analytics, and start automated workflows. AI-powered anomaly detection helps you find problems in streaming data and adjust to new patterns.
You get real-time intelligence for every event and can act fast to help your business.
Automating Real-Time Actions
Triggering Workflows
You can set up automatic actions in Microsoft Fabric. Data Activator lets you automate things without coding. You just pick what should start the action, like a high temperature or a jump in sales. The system watches live data from IoT devices and business tools. When your rule matches an event, Microsoft Fabric sends emails or Teams messages. It can also work with other systems to do special tasks.
Here is a table that lists workflow automation tools in Microsoft Fabric:
You can smooth out data to ignore random changes. This helps you see what matters most. You get useful tips and make better choices. Real-time intelligence helps you react fast to changes. You work better and do not need to do as much by hand.
Tip: Use triggers in Microsoft Fabric to set up alerts and actions. This saves time and helps you make smart choices with your data.
Continuous Improvement
You check how well automation works by watching how people use reports. Power BI’s Usage Metrics show which dashboards people look at most. Microsoft Purview helps you see how data is used and who uses it. You can talk about feedback in Teams to make dashboards better and get more people to use them.
Companies use analytics in Microsoft Fabric to connect report use with business goals. You look at how well things work to see if intelligence helps results. SharePoint is a place to share reports and get feedback from others.
Here are some ways different industries use real-time automation:
Automation in Microsoft Fabric turns data into helpful tips. You can react fast to market changes and make customers happier. Real-time intelligence helps you plan ahead and keep making your business better.
You get strong value when you use data in motion with Microsoft Fabric. You make analytics easier and set up automatic actions. This helps you build dashboards that show live data. It also helps you make better choices. Companies say they have less downtime and workers do their jobs better. They also get their money back fast.
To get ready for the future, you should:
Set rules to keep data safe and follow laws.
Help everyone use data first.
Share why Microsoft Fabric is useful.
Connect and manage data in your dashboard.
You will see more automation with AI and real-time data in one place. These changes help you get useful answers and keep your analytics up to date.
FAQ
What is Microsoft Fabric’s Real-Time Hub?
You use Real-Time Hub to handle streaming events. It helps you see live analytics in one spot. The platform lets you capture and process events as they happen. You can watch events and get instant insights. You can set up automatic actions for better results.
How do you connect different data sources in Microsoft Fabric?
You connect cloud, on-premises, and other systems with built-in connectors. The platform works with SQL, NoSQL, APIs, and business tools. You see all your data together. This helps you make choices faster.
Can you automate actions based on live events?
You set triggers in Data Activator. The system looks for special events and starts workflows by itself. You can send alerts, update dashboards, or connect with other business systems. You do not need to write code.
How does KQL help with real-time visualization?
You use KQL to make dashboards that show live trends. The query language connects to streaming data. You can build visualizations for instant analysis. You watch key numbers and spot changes fast.
Is Microsoft Fabric secure for sensitive business information?
You keep your information safe with encryption and identity management. The platform labels data and tracks how it is used. You control who can see data and follow security rules.