Why Power BI Dashboards Matter for Modern Businesses
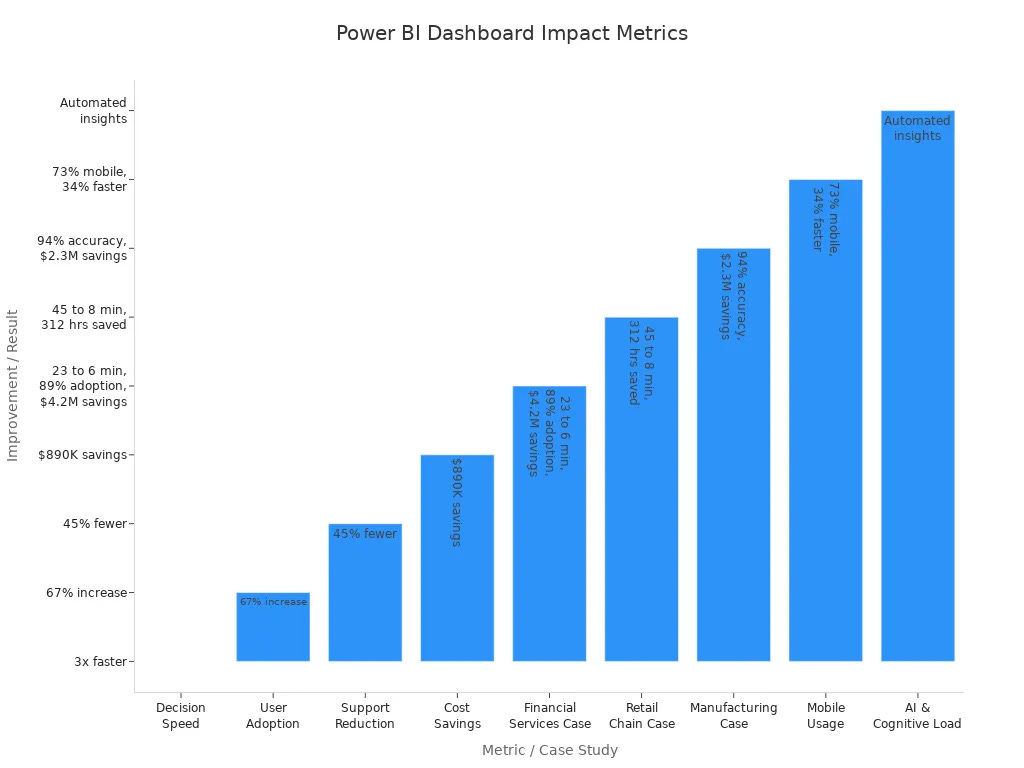
You need quick answers to business questions. Power BI Dashboards show your main numbers on one page. Leaders and teams see important data right away. This helps you make smart choices faster. Studies say decisions happen three times faster. Mobile layouts help 73% of leaders use dashboards easily.
Your dashboard looks nice and works on any device. You can check your progress anywhere.
Key Takeaways
Power BI Dashboards put your main business numbers on one page. This helps you make choices faster and smarter.
Dashboards show new data right away, so you can see problems early. You can fix things quickly. You can use dashboards on any device. This includes phones and tablets. You can stay updated anywhere.
Dashboards bring data from many places into one easy view. This saves time and helps you make fewer mistakes. You can click and explore data with interactive features. It is easy to follow goals and find important facts.
Power BI Dashboards Overview
What Is a Power BI Dashboard
You need to see your business clearly and fast. Power BI Dashboards help you do this. A Power BI Dashboard is one page. It shows your most important numbers and trends. You can see all your key metrics in one spot. This helps you notice changes and act quickly.
Power BI Dashboards let you watch your business in real time. You do not wait for reports or search many pages. You get a quick summary to help you decide fast.
You can use Power BI Dashboards on your computer, tablet, or phone. This means you can check your business from anywhere. For example, a retail manager can see sales, profit, inventory, and customer visits on one page. You do not need to open lots of files or apps.
Here is how Power BI Dashboards and Power BI reports are different:
Key Features
Power BI Dashboards have many features to help you stay updated:
You see all your key metrics on one page.
You get real-time updates, so you always know what is happening.
You can use dashboards on any device.
You can share dashboards with your team easily.
You see simple visuals that make trends easy to spot.
You use Power BI Dashboards for quick answers and a clear view. You use Power BI reports when you want to look deeper into the data.
Business Benefits
Real-Time Insights
You want answers fast. Power BI Dashboards show you data right now. You see what is happening in your business at this moment. This helps you find problems early and spot new ways to grow. You do not wait for old reports. You get new numbers every time you open your dashboard.
Real-time dashboards help you fix problems fast and make smart choices. You can check sales, costs, or customer feedback as soon as they change.
Many companies use real-time dashboards to work better. For example, Pfizer checks clinical trials to make new drugs faster. Heathrow Airport watches how many people are in lines to cut wait times. Tesla looks at car performance and customer feedback to make better products. These dashboards help leaders act fast and stay ahead.
Here is a table that shows how different dashboards help with real-time choices:
KPI Tracking
You need to know if your business is doing well. Power BI Dashboards help you follow key performance indicators (KPIs) every day. You see your goals and progress in one place. This makes it easy to spot trends and fix problems before they get big.
You track sales goals, customer happiness, and costs.
You set alerts for big changes.
You compare results for teams or places.
For example, sales managers use dashboards to see which products sell best. HR teams watch how many workers leave and how training is going. Marketing teams check campaign results and website visits. You use these facts to make better choices and reach your goals faster.
Data Consolidation
You get data from many places. Power BI Dashboards bring all your data together. You see everything in one view. This helps you avoid mistakes and saves time.
Dashboards connect to databases, cloud services, Excel files, and business apps. You do not need to copy data by hand or switch between systems.
When you put data together, you get a clear view of your business. You break down walls between teams and make sure everyone sees the same numbers. This helps teams work together and make choices with confidence.
You connect sales, stock, and money data for a full view.
You use live dashboards to watch KPIs and get alerts.
You share dashboards with your team to solve problems together.
A logistics company used dashboards to link truck GPS, warehouse stock, and shipping data. This helped them cut shipping delays and give better service. A consumer electronics brand watched machine performance and had less downtime by using one dashboard for all their data.
Power BI Dashboards turn messy data into clear facts. You save time, make fewer mistakes, and help your team work better together.
Customization and Usability
Visual Appeal
You want your dashboard to look good and help you understand data quickly. Power BI Dashboards use clear colors, simple charts, and smart layouts. You see the most important numbers first. Lighter backgrounds make reading easy. Contrasting colors highlight key facts. You follow a story from top left to bottom right, just like reading a book. Good design helps you spot trends and make decisions faster.
Tip: Place your main metrics at the top left. Use bar charts for comparisons and keep pie charts simple. Remove extra labels to avoid clutter.
You can choose from many templates for sales, marketing, finance, and more. These templates save time and help you follow best practices. You can also change colors, chart types, and layout to match your brand.
Interactivity
You need to explore data, not just look at it. Power BI Dashboards let you filter by region, date, or team. Slicers help you focus on what matters. Drill-through features let you click for more details. Bookmarks save your favorite views. Tooltips show extra facts when you hover over a chart.
You can ask questions in plain language and get instant answers.
You make decisions faster because you see real-time changes.
Interactive dashboards turn numbers into stories. You feel more involved and find insights that static reports miss.
Mobile Access
You want to check your dashboard anywhere. Power BI Dashboards work on phones, tablets, and computers. You get alerts and updates on your device. You respond to problems right away. Mobile access helps you stay agile and make quick choices.
You share dashboards with your team using Microsoft tools.
You track key metrics even when you travel.
Security matters too. Power BI uses strong controls to keep your data safe. You decide who can see or change your dashboard. This protects your business and builds trust.
You get the most from your business data with dashboards made for you. These tools help you in many ways.
You see KPIs and trends right away, so you can act quickly.
You pay attention to your most important business goals.
You look at data using simple filters and interactive visuals.
You can trust your data because it is safe and updated often.
You make better choices in any field, like finance or healthcare.
When you make dashboards fit your team, you link KPIs to business goals. You also help everyone use dashboards often. This builds a smart culture that uses data for choices. Try dashboards now to help your business do better and grow.
FAQ
Why should you use dashboards instead of traditional reports?
Dashboards give you quick answers. You see important numbers right away. You do not need to read long reports. This helps you act faster and spot problems early.
Why do dashboards help teams work better together?
Dashboards show everyone the same data. Your team sees updates at the same time. This builds trust and helps you make decisions as a group.
Why is real-time data important for your business?
Real-time data lets you see what happens as it happens. You can fix issues quickly. You also find new chances to grow your business.
Why do dashboards make it easier to track goals?
Dashboards display your goals and progress in one place. You see if you meet targets. You can change your plan if you fall behind.
Why does mobile access matter for dashboards?
Mobile access lets you check your data anywhere. You stay informed when you travel or work from home. You never miss important updates.