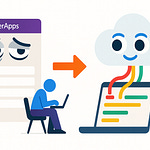
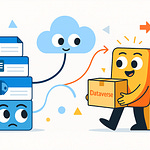
If you’ve been comfortable building dashboards in Power BI, the ground just shifted. Power BI alone is no longer the full story. Fabric isn’t just a version update—it reworks how analytics fits together.
You can stop being the person who only makes visuals. You can shape data with pipelines, run live analytics, and even bring AI into the mix, all inside the same ecosystem.
So here’s the real question: are your current Power BI skills still enough? By the end of this podcast, you’ll know how to provision access, explore OneLake, and even test a streaming query yourself. And that starts by looking at the hidden limits you might not realize have been holding Power BI back.
The Hidden Limits of Traditional Power BI
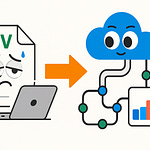
Most Power BI professionals don’t realize they’ve been working inside invisible walls. On the surface, it feels like a complete toolkit—you connect to sources, build polished dashboards, and schedule refreshes. But behind that comfort lies a narrow workflow that depends heavily on static data pulls. Traditional Power BI setups often rely on scheduled refreshes rather than streaming or unified storage, which means you end up living in a world of snapshots instead of live insight.
For most teams, the process feels familiar. A report is built, published to the Power BI service, and the refresh schedule runs once or twice a day. Finance checks yesterday’s numbers in the morning. Operations gets weekly or monthly summaries. The cadence seems manageable, and it has been enough—until expectations change. Businesses don’t only want to know what happened yesterday; they want visibility into what’s happening right now. And those overnight refreshes can’t keep up with that demand.
Consider a simple example. Executives open their dashboard mid-afternoon, expecting live figures, only to realize the dataset won’t refresh until the next morning. Decisions get made on outdated numbers. That single gap may look small, but it compounds into missed opportunities and blind spots that organizations are less and less willing to tolerate. Ask yourself this: does your team expect sub-hourly, operational analytics? If the answer is yes, those scheduled refresh habits no longer fit the reality you’re working in.
The challenge is bigger than just internal frustration. The market has moved forward. Organizations compare Power BI against entire analytics ecosystems—stacks built around streaming data, integrated lakehouses, and real-time processing. Competitors showcase dashboards where new orders or fraud alerts appear second by second. Against that backdrop, “refreshed overnight” no longer feels like a strength; it feels like a gap.
And here’s where it gets personal for BI professionals. The skills that once defined your value now risk being seen as incomplete. Leaders may love your dashboards, but if they start asking why other platforms deliver real-time feeds while yours are hours behind, your credibility takes the hit. It’s not that your visuals aren’t sharp—it’s that the role of “report builder” doesn’t meet the complexity of today’s demands. Without the ability to help design the actual flow of data—through transformations, streaming, or orchestration—you risk being sidelined in conversations about strategy.
Microsoft has been watching the same pressures. Executives were demanding more than static reporting layers, and BI pros were feeling boxed in by the setup they had to work with. Their answer wasn’t a slight patch or an extra button—it was Fabric. Not framed as another option inside Power BI Desktop, but launched as a reimagined foundation for analytics within the Microsoft ecosystem. The goal was to collapse silos so the reporting layer connects directly to data engineering, warehousing, and real-time streams without forcing users to switch stacks.
The shift is significant. In the traditional model, Power BI was the presentation layer at the end of someone else’s pipeline. With Fabric, those boundaries are gone. You can shape data upstream, manage scale, and even join live streams into your reporting environment. But access to these layers doesn’t make the skills automatic. What looks exciting to leadership will feel like unfamiliar territory to BI pros who’ve never had to think about ETL design or pipeline orchestration. The opportunity is real, but so is the adjustment.
The takeaway is clear: relying on the old Power BI playbook won’t be enough as organizations shift toward integrated, real-time analytics. Fabric changes the rules of engagement, opening up areas BI professionals were previously fenced out of. And here’s where many in the community make their first misstep—by assuming Fabric is simply one more feature added on top of Power BI.
Why Fabric Isn’t Just ‘Another Tool’
Fabric is best understood not as another checkbox inside Power BI, but as a platform shift that redefines where Power BI fits. Conceptually, Power BI now operates within a much larger environment—one that combines engineering, storage, AI, and reporting under one roof. That’s why calling Fabric “just another tool” misses the reality of what Microsoft has built.
The simplest way to frame the change is with two contrasts. In the traditional model, Power BI was the end of the chain: you pulled from various sources, cleaned with Power Query, and pushed a dataset to the service. Scheduling refreshes was your main lever for keeping data in sync. In the Fabric model, that chain disappears. OneLake acts as a single foundation, pipelines handle transformations, warehousing runs alongside reporting, and AI integration is built in. Instead of depending on external systems, Fabric folds those capabilities into the same platform where Power BI lives.
For perspective, think about how Microsoft once repositioned Excel. For years it sat at the center of business processes, until Dynamics expanded the frame. Dynamics wasn’t an Excel update—it was a shift in how companies handled operations end to end. Fabric plays a similar role: it resets the frame so you’re not just making reports at the edge of someone else’s pipeline. You’re working within a unified data platform that changes the foundation beneath your dashboards.
Of course, when you first load the Fabric interface, it doesn’t look like Power BI Desktop. Terms like “lakehouse,” “KQL,” and “pipelines” can feel foreign, almost like you’ve stumbled into a developer console instead of a reporting tool. That first reaction is normal, and it’s worth acknowledging. But you don’t need to become a full-time data engineer to get practical wins. A simple way to start is by experimenting with a OneLake-backed dataset or using Fabric’s built-in dataflows to replicate something you’d normally prep in Power Query. That experiment alone helps you see the difference between Fabric and the workflow you’ve relied on so far.
Ignoring this broader environment has career consequences. If you keep treating Power BI as only a reporting canvas, you risk being viewed as the “visual designer” while others carry the strategic parts of the data flow. Learning even a handful of Fabric concepts changes that perception immediately. Suddenly, you’re not just publishing visuals—you’re shaping the environment those visuals depend on.
Here’s a concrete example. In the old setup, analyzing large transactional datasets often meant waiting for IT to pre-aggregate or sample data. That introduced delays and trade-offs in what you could actually measure. Inside Fabric, you can spin up a warehouse in your workspace, tie it directly to Power BI, and query without moving or trimming the data. The dependency chain shortens, and you’re no longer waiting on another team to decide what’s possible.
Microsoft’s strategy reflects where the industry has been heading. There’s been a clear demand for “lakehouse-first” architectures: combining the scalability of data lakes with the performance of warehouses, then layering reporting on top. Competitors have moved this way already, and Fabric positions Power BI users to be part of that conversation without leaving Microsoft’s ecosystem. That matters because reporting isn’t convincing if the underlying data flow can’t handle speed, scale, or structure.
For BI professionals, the opportunity is twofold. You protect your relevance by learning features that extend beyond the visuals, and you expand your influence by showing leadership how Fabric closes the gap between reports and strategy. The shift is real, but it doesn’t require mastering every engineering detail. It starts with small, real experiments that make the difference visible.
That’s why Fabric shouldn’t be thought of as an option tacked onto Power BI—it’s the table that Power BI now sits on. If you frame it that way, the path forward is clearer: don’t retreat from the new environment, test it. The good news is you don’t need enterprise IT approval to begin that test.
Next comes the practical question: how do you actually get access to Fabric for yourself? Because the first roadblock isn’t understanding the concepts—it’s just getting into the system in the first place.
Getting Your Hands Dirty: Provisioning a Fabric Tenant
Provisioning a Fabric tenant is where the shift becomes real. For many BI pros, the idea of setting one up sounds like a slow IT request, but in practice it’s often much faster than expected. You don’t need weeks of approvals, and you don’t need to be an admin buried in Azure settings. The process is designed so that individual professionals can get hands-on without waiting in line.
We’ve all seen how projects stall when a new environment request gets buried in approvals. A team wants a sandbox, leadership signs off, and then nothing happens for weeks. By the time the environment shows up, curiosity is gone and the momentum is dead. That’s exactly what Fabric is trying to avoid. Provisioning puts you in charge of starting your own test environment, so you don’t have to sit on the sidelines waiting for IT to sign off.
Here’s the key point: most people find they can spin up a personal Fabric tenant faster than they assumed—often in the same day. Think of it less as a technical build-out and more like filling out a sign-up form. Microsoft offers developer tenants specifically for Fabric, and while trial details can differ by account or region, many report being able to register quickly. Before you dive in, always check Microsoft’s current enrollment documentation to verify trial terms—especially the exact length of trial access, since that can change.
So what does “provisioning” look like here? It isn’t hardware. It isn’t finding budget for servers. It’s simply setting up a space under your login with three key components:
First, you get the organizational shell—the container where your Fabric services live.
Second, you have identity control—it’s tied to your sign-in, so you’re in charge of access.
And third, you get sandboxed resources—an environment to test everything Fabric promises without risking production data.
Think of it as pressing a button and watching your own lab environment appear.
A simple way to picture it is with a small story. You sit down curious about Fabric but assume it’s going to be complicated. Instead of endless documentation and IT back-and-forth, you walk through a short form, select a Fabric tenant option, and within the same coffee break you’re exploring a clean workspace. The barrier you expected isn’t there, and you’re already testing a pipeline or seeing how DirectLake might behave. That moment turns Fabric from abstract to hands-on very quickly.
One caution to keep in mind: trials come with names that sound alike. You might see options for a Power BI Premium Per User trial or a Fabric developer tenant trial. Watch closely. The first affects premium reporting features; the second is what gives you access to the broader Fabric ecosystem. Always review what trial you’re activating so you don’t wonder later why your screen looks different from the demos. This is an easy place to mix things up, so confirm the scope of your trial against the documentation for your specific tenant.
Once the signup is squared away, what you end up with is a safe playground. It’s outside your company’s production environment, so mistakes don’t hurt anyone. You can create a pipeline, test a warehouse, or connect a dataset without waiting for permissions. For BI pros used to being gated by IT processes, that’s a big inversion. Suddenly you own the pace of your learning.
Here’s a quick challenge you can try once you’ve signed up: give yourself 15 minutes, create a single pipeline or dataset, and just see what happens. It’s a low-stakes way to move from theory into action. You’re not aiming to master Fabric in one sitting—you’re just proving to yourself that this environment is open and ready. The act of building even one object shifts your perspective.
What makes this valuable isn’t just speed; it’s the freedom to test and explore without risking production. Nobody is waiting for approvals, nobody’s worried about governance policies being broken, and nobody’s blocked from trying ideas. For the first time, BI pros can approach Fabric with the same curiosity developers bring into new environments. And that hands-on approach accelerates learning far faster than reading feature lists ever could.
From here, the natural question is obvious: once you’ve got this sandbox, what should you build that will actually show Fabric’s differences? The answer sits at the foundation of everything Fabric does. It starts with the way your data is stored and shared, and that’s where the idea of OneLake comes in.
OneLake and Beyond: Engineering Your Own Data
When you first start working inside Fabric, one of the most immediate shifts you’ll notice is how the platform approaches storage. This is where OneLake enters the picture. It’s designed to serve as a single storage layer for data across Fabric, reducing the scattering of sources that most BI professionals have had to manage piecemeal for years. Instead of juggling SQL here, SharePoint there, and half a dozen Excel files acting as “sources of truth,” every component of Fabric points back to the same foundation.
You can think of OneLake as the connective layer that makes Fabric feel cohesive. If Power BI represents your reporting canvas and Data Factory provides the pipeline tooling, OneLake is where they converge. Without a shared layer, you’d still be stuck with multiple silos, each demanding its own refresh and upkeep. With it, the reporting, engineering, and storage pieces line up around the same data objects. It isn’t something you toggle on and off—it’s the storage model Fabric is set up to use. That design choice is what makes learning its role so important early on.
For anyone who’s lived deep in the traditional Power BI workflow, the difference is easy to recognize. Normally, you construct reports against whatever connections IT makes available and spend your days policing gateway errors or mismatched refresh schedules. You’ve probably seen the chaos of multiple “final_v2.xlsx” files drifting through Teams folders while departments argue over who’s right. That fragmented approach may get you through when teams are small, but it collapses at scale, especially when executives expect clean and aligned numbers. OneLake shifts that balance by letting everyone operate against the same shared storage location, where duplication is minimized and disagreements over timing start to disappear.
A good way to picture it is by drawing on Microsoft’s own playbook. OneDrive consolidated scattered file shares into one cloud surface—people edit and share a file directly, instead of emailing copies around. OneLake applies the same principle to datasets. Instead of making multiple extracted versions of the same transaction table, teams query the same underlying object. The net benefit is as simple as it is practical: fewer copies drifting around and far better alignment across teams.
Take a basic scenario: finance analyzing P&L reports while operations reviews sales performance. In a traditional setup, the two departments could be looking at different refresh cycles, reporting lags, or even different extracts of the same database. The result? Discrepancies in numbers at the worst time—midway through a meeting. With OneLake, both point at the same object, reducing that misalignment. Different views, yes, but anchored to the same data foundation.
That shift doesn’t just simplify reporting—it reshapes your role. Before, BI teams were consumers at the edge of IT-managed pipelines. You pulled what you were given and hoped it was current. With Fabric’s shared lake, you’re now on the same footing as the engineers who set up the flows. Instead of requesting data prep, you gain access to objects in a way that cuts down on waiting and rework. While governance still matters, the wall between “engineers who control” and “BI pros who consume” isn’t as rigid as it used to be.
Another feature here is DirectLake. Instead of relying on scheduled refresh cycles to load snapshots into your models, reports can connect straight into OneLake for queries. The promise is that you minimize the lag between source activity and reporting availability. Many users describe this as reducing their need for scheduled refresh in significant ways—but behavior varies depending on environment and data structure. If you’re testing this in your own sandbox, verify how it behaves with your datasets. For some workloads, it may transform how often you touch refresh at all.
Here’s a small, actionable way to explore this for yourself: once you’ve provisioned a Fabric trial or developer tenant, connect a Power BI report to a dataset stored in OneLake. Pay attention to whether refresh management changes compared to your usual model. Does the report update more seamlessly? Is there less overhead in scheduling? Treat it as an experiment. The goal isn’t to master the entire system on day one—it’s to see firsthand what’s different about working off a shared layer rather than a patched-on extract.
What becomes clear from this pattern is that Fabric alters the normal division of labor. BI professionals now have a direct line into the storage environment, which used to sit squarely on the IT side. That visibility brings responsibility but also influence. You’re not just making pages of visuals—you’re operating in the same environment that handles raw ingestion and transformation. The overlap of roles creates opportunities for you to step into strategy conversations that might have been off-limits before.
Summing it up: OneLake isn’t another optional feature. It’s the foundation Fabric is built to run on, and understanding how it changes the way data is stored is essential for seeing how BI roles evolve. It reduces reliance on copies, cuts down refresh headaches, and brings teams onto the same page by anchoring everything to a single, shared layer.
But storage alignment only goes so far. Some decisions can’t wait for the next dataset to be updated, even if refresh cycles are gone. The next challenge is dealing with events as they happen—and that’s where Fabric takes BI professionals into a space many haven’t touched before.
Real-Time Thinking with KQL Databases
Dashboards that wait around for refresh schedules feel outdated. The expectation now is that data should be visible as it happens, not hours later. This is exactly where real-time analytics meets Fabric, and where KQL databases take center stage.
KQL, short for Kusto Query Language, has been part of Microsoft’s ecosystem for some time. It has powered several services in Azure (note: confirm exact list of services like Azure Data Explorer and Log Analytics against Microsoft documentation before recording). What matters here is that BI professionals can now use KQL databases directly inside Fabric, not just watch from the sidelines. Instead of working with datasets frozen until the next refresh, you can connect dashboards to event streams and run queries as those events arrive. For BI pros, this changes Power BI from being a look-back mirror into something closer to a live operational tool.
If you already know SQL, KQL won’t feel completely foreign. Many describe it as approachable for SQL users, though it’s optimized for streams and telemetry rather than static tables (verify this point against product documentation). The mindset shift is important: instead of importing rows, shaping them, and waiting for the next scheduled pull, you’re watching data flow in and querying it as it lands. That change takes dashboards out of “recap mode” and into “action mode.”
Here’s a simplified example. Imagine a support center running on daily CRM extracts. Yesterday’s call volume, ticket backlog, and resolution times appear on screens the following morning. Useful, but too late to stop a service slip in real time. With a KQL database sending new tickets straight to a report, managers see the spikes as they form. Backlogs don’t sit unseen until tomorrow—they’re visible mid-shift, giving leaders a chance to reassign staff or respond right away. Seeing tickets as they come in lets managers intervene immediately, and that’s the direct benefit you can’t get from a refresh cycle.
This isn’t just about call centers. Many industries already expect data to refresh continuously. Retail operations monitor sales by location minute by minute and adjust staffing on the fly. Financial services screen transactions the second they occur to cut fraud losses. Logistics companies don’t just batch delivery updates—they track GPS signals streaming in all day. None of these scenarios can run on nightly refreshes. They rely on systems tuned for streams, and KQL brings that capability inside the Microsoft stack BI pros already know.
The good news is you don’t need to be a developer to start here. Many find KQL straightforward if they’re familiar with SQL—expect a learning curve, but not a wall. The payoff is significant: moving from reporting on history to influencing live operations. And that move matters inside organizations. If your dashboards help leadership react before a problem escalates, you’re no longer the person wrapping things up after the fact. You become someone steering actions while they still matter.
This shift also breaks down old boundaries. In the past, BI professionals stuck to visuals and let developers or IT teams handle streaming feeds. With KQL available inside Fabric, those lines blur. You’re no longer locked out of event-driven datasets. You can build dashboards tied to streams yourself, owning the models that inform operational decisions. That expansion of scope changes how your role is perceived—and in many cases, how central you are to outcomes.
So what’s a low-barrier way to try this? If you’ve set up a Fabric tenant, see if your environment lets you run a basic KQL query against an event stream. Even something small, like querying a sample log or telemetry feed, will show you how results update in real time. Treat it as an experiment, not a guarantee that every tenant tier or trial includes KQL. The takeaway is whether you experience how different it feels to watch data update continuously rather than wait for a scheduled push.
For BI professionals, that moment changes what “building a dashboard” means. It’s no longer a static artifact that lags behind operations—it’s a live surface where decisions happen. Leaning into KQL broadens your toolkit, but more importantly, it shifts you into the stream of operational analytics where the business is already moving.
This isn’t theory; it’s a structural change in how reporting fits inside organizations. And as these changes accumulate—from shared storage layers like OneLake to streaming queries in KQL—the old definition of Power BI work starts to look too narrow. The larger message is clear: relying on yesterday’s playbook won’t cover tomorrow’s demands.
Conclusion
In many organizations, Power BI alone is starting to feel insufficient for the kind of operational analytics leaders expect. Fabric expands those options by pulling BI work into the full data pipeline, from storage to real-time feeds. The opportunity for BI pros is to step into that wider environment instead of staying at the reporting edge.
If you want a practical path forward: assess where your own workflow gaps are, set up a sandbox tenant, and try one small experiment—maybe creating a dataset in OneLake or running a basic KQL query. Then, share in the comments which part of Fabric feels most challenging for you: provisioning, OneLake, or KQL.
If this video gave you a clearer view of how your role can grow beyond dashboards, consider liking and subscribing. It helps the channel reach more BI professionals rethinking their skills for what comes next.


