Most people still think of ASP.NET Core as just another web framework… but what if I told you that inside .NET 10, there’s now an AI engine quietly shaping the way your apps think, react, and secure themselves? I’ll explain what I mean by “AI engine” in concrete terms, and which capabilities are conditional or opt-in — not just marketing language.
This isn’t about vague promises. .NET 10 includes deeper AI-friendly integrations and improved diagnostics that can help surface issues earlier when configured correctly. From WebAuthn passkeys to tools that reduce friction in debugging, it connects AI, security, and productivity into one system. By the end, you’ll know which features are safe to adopt now and which require careful planning.
So how do AI, security, and diagnostics actually work together — and should you build on them for your next project?
The AI Engine Hiding in Plain Sight
What stands out in .NET 10 isn’t just new APIs or deployment tools — it’s the subtle shift in how AI comes into the picture. Instead of being an optional side project you bolt on later, the platform now makes it easier to plug AI into your app directly. This doesn’t mean every project ships with intelligence by default, but the hooks are there. Framework services and templates can reduce boilerplate when you choose to opt in, which lowers the barrier compared to the work required in previous versions.
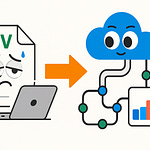
That may sound reassuring, especially for developers who remember the friction of doing this the old way. In earlier releases, if you wanted a .NET app to make predictions or classify input, you had to bolt together ML.NET or wire up external services yourself. The cost wasn’t just in dependencies but in sheer setup: moving data in and out of pipelines, tuning configurations, and writing all the scaffolding code before reaching anything useful. The mental overhead was enough to make AI feel like an exotic add-on instead of something practical for everyday apps.
The changes in .NET 10 shift that balance. Now, many of the same patterns you already use for middleware and dependency registration also apply to AI workloads. Instead of constructing a pipeline by hand, you can connect existing services, models, or APIs more directly, and the framework manages where they fit in the request flow. You’re not forced to rethink app structure or hunt for glue code just to get inference running. The experience feels closer to snapping in a familiar component than stacking a whole new tower of logic on top.
That integration also reframes how AI shows up in applications. It’s not a giant new feature waving for attention — it’s more like a low-key participant stitched into the runtime. Illustrative scenario: a commerce app that suggests products when usage patterns indicate interest, or a dashboard that reshapes its layout when telemetry hints at frustration. This doesn’t happen magically out of the box; it requires you to configure models or attach telemetry, but the difference is that the framework handles the gritty connection points instead of leaving it all on you. Even diagnostics can benefit — predictive monitoring can highlight likely causes of issues ahead of time instead of leaving you buried in unfiltered log trails.
Think of it like an electric assist in a car: it helps when needed and stays out of the way otherwise. You don’t manually command it into action, but when configured, the system knows when to lean on that support to smooth out the ride. That’s the posture .NET 10 has taken with AI — available, supportive, but never shouting for constant attention.
This has concrete implications for teams under pressure to ship. Instead of spending a quarter writing a custom recommendation engine, you can tie into existing services faster. Instead of designing a telemetry system from scratch just to chase down bottlenecks, you can rely on predictive elements baked into diagnostics hooks. The time saved translates into more focus on features users can actually see, while still getting benefits usually described as “advanced” in the product roadmap.
The key point is that intelligence in .NET 10 sits closer to the foundation than before, ready to be leveraged when you choose. You’re not forced into it, but once you adopt the new hooks, the framework smooths away work that previously acted as a deterrent. That’s what makes it feel like an engine hiding in plain sight — not because everything suddenly thinks on its own, but because the infrastructure to support intelligence is treated as a normal part of the stack.
This tighter AI integration matters — but it can’t operate in isolation. For any predictions or recommendations to be useful, the system also has to know which signals to trust and how to protect them. That’s where the focus shifts next: the connection between intelligence, security, and diagnostics.
Security That Doesn’t Just Lock Doors, It Talks to the AI
Most teams treat authentication as nothing more than a lock on the door. But in .NET 10, security is positioned to do more than gatekeep — it can also inform how your applications interpret and respond to activity. The framework includes improved support for modern standards like WebAuthn and passkeys, moving beyond traditional username and password flows. On the surface, these look like straightforward replacements, solving long‑standing password weaknesses. But when authentication data is routed into your telemetry pipeline, those events can also become additional inputs for analytics or even AI‑driven evaluation, giving developers and security teams richer context to work with.
Passwords have always been the weak link: reused, phished, forgotten. Passkeys are designed to close those gaps by anchoring authentication to something harder to steal or fake, such as device‑bound credentials or biometrics. For end users, the experience is simpler. For IT teams, it means fewer reset tickets and a stronger compliance story. What’s new in the .NET 10 era is not just the support for these standards but the potential to treat their events as real‑time signals. When integrated into centralized monitoring stacks, they stop living in isolation. Instead, they become part of the same telemetry that performance counters and request logs already flow into. If you’re evaluating .NET 10 in your environment, verify whether built‑in middleware sends authentication events into your existing telemetry provider and whether passkey flows are available in template samples. That check will tell you how easily these signals can be reused downstream.
That linkage matters because threats don’t usually announce themselves with a single glaring alert. They hide in ordinary‑looking actions. A valid passkey request might still raise suspicion if it comes from a device not previously associated with the account, or at a time that deviates from a user’s regular behavior. These events on their own don’t always mean trouble, but when correlated with other telemetry, they can reveal a meaningful pattern. That’s where AI analysis has value — not by replacing human judgment, but by surfacing combinations of signals that deserve attention earlier than log reviews would catch.
A short analogy makes the distinction clear. Think of authentication like a security camera. A basic camera records everything and leaves you to review it later. A smarter one filters the feed, pinging you only when unusual behavior shows up. Authentication on its own is like the basic camera: it grants or denies and stores the outcome. When merged into analytics, it behaves more like the smart version, highlighting out‑of‑place actions while treating normal patterns as routine. The benefit comes not from the act of logging in, but from recognizing whether that login fits within a broader, trusted rhythm.
This reframing changes how developers and security architects think about resilience. Security cannot be treated as a static checklist anymore. Attackers move fast, and many compromises look like ordinary usage right up until damage is done. By making authentication activity part of the signal set that AI or advanced analytics can read, you get a system that nudges you toward proactive measures. It becomes less about trying to anticipate every exploit and more about having a feedback loop that notices shifts before they explode into full incidents.
The practical impact is that security begins to add value during normal operations, not just after something goes wrong. Developers aren’t stuck pushing logs into a folder for auditors, while security teams aren’t the only ones consuming sign‑in data. Instead, passkey and WebAuthn events enrich the telemetry flow developers already watch. Every authentication attempt doubles as a micro signal about trustworthiness in the system. And since this work rides along existing middleware and logging integrations, it places little extra burden on the people building applications.
This does mean an adjustment for many organizations. Security groups still own compliance, controls still apply — but the data they produce is no longer siloed. Developers can rely on those signals to inform feature logic, while monitoring systems use them as additional context to separate real anomalies from background noise. Done well, it’s a win on both fronts: stronger protection built on standards users find easier, and a feedback loop that makes applications harder to compromise without adding friction.
If authentication can be a source of signals, diagnostics is the system that turns those signals into actionable context.
Diagnostics That Predict Breakdowns Before They Happen
What if the next production issue in your app could signal its warning signs before it ever reached your users? That’s the shift in focus with diagnostics in .NET 10. For years, logs were reactive — something you dug through after a crash, hoping that one of thousands of lines contained the answer. The newer tooling is designed to move earlier in the cycle. It’s less about collecting more entries, and more about surfacing patterns that might point to trouble when telemetry is configured into monitoring pipelines.
The important change is in how telemetry is treated. Traditionally, streams of request counts, CPU measurements, or memory stats were dumped into dashboards that humans had to interpret. At best, you could chart them and guess at correlations. In .NET 10, the design makes it easier to establish baselines and highlight anomalies. When telemetry is integrated with analytics models — whether shipped or added by your team — the platform can help you define what’s “normal” over time. That might mean noticing how latency typically drifts during load peaks, or tracking how memory allocations fluctuate before batch jobs kick in. With this context, deviations become obvious far earlier than raw counters alone would show.
Volume has always been part of the problem. When incidents strike, operators often have tens of thousands of entries to sift through. Identifying when the problem actually started becomes the hardest part. The result is slower response and exhausted engineers. Diagnostics in .NET 10 aim to trim the noise by prioritizing shifts you actually need to care about. Instead of thirty thousand identical service-call logs, you might see a highlighted message suggesting one endpoint is trending 20 percent slower than usual. It doesn’t fix the issue for you, but it does save the digging by pointing attention to the right area first.
Illustrative scenario: imagine you’re running an e‑commerce app where checkout requests usually finish in half a second. Over time, monitoring establishes this as the healthy baseline. If a downstream dependency slows and pushes that number closer to one second, users may not complain right away — but you’re already losing efficiency, and perhaps sales. With anomaly detection configured, diagnostics could flag the gradual drift early, giving your team time to investigate and patch before the customer feels it. That’s the difference between firefighting damage and quietly preserving stability.
A useful comparison here is with cars. You don’t wait until an engine seizes to know maintenance is needed. Sensors watch temperature, vibration, and wear, then let you know weeks ahead that failure is coming. Diagnostics, when properly set up in .NET 10, work along similar lines. You’re not just recording whether your service responds — you’re watching for the micro‑changes that add up to bigger problems, and you’re spotting them before roadside breakdowns happen.
These feeds also extend beyond performance. Because they’re part of your telemetry flow, the same insights could strengthen other systems. Security models, for example, may benefit when authentication anomalies are checked against unusual latency spikes. Operations teams can adjust resource allocation earlier in a deployment cycle when those warnings show up. That reuse is part of the appeal: the same baseline awareness serves multiple needs instead of living in a silo.
It also changes the balance between engineers and their tools. In older setups, logs provided the raw material, and humans did nearly all of the interpretive work. Here, diagnostics can suggest context — pointing toward a likely culprit or highlighting when a baseline is drifting. The goal isn’t to remove engineers from the loop but to cut the time needed to orient. Instead of asking “when did this start?” you begin with a clear signal of which metric moved and when. That can shave hours off mean time to resolution.
When testing .NET 10 in your own environment, it helps to look for practical markers. Check whether telemetry integrates cleanly with your monitoring solution. Look at whether anomaly detection options exist in the pipeline, and whether diagnostics expose suggested root causes or simply more raw logs. That checklist will make the difference between treating diagnostics as a black box and actually verifying where the gains show up.
Of course, more intelligence can add more tools to watch. Dashboards, alerts, and suggested insights all bring their own learning curve. But the intent isn’t to increase your overhead — it’s to shorten the distance from event to action. The realistic payoff is reduced time to context: your monitoring can highlight a probable source and suggest where to dig, even if the final diagnosis still depends on you.
Which brings us to orchestration: how do you take these signals and actually make them usable across services and teams? That’s where the next piece comes in.
Productivity Without the Guesswork: Enter .NET Aspire
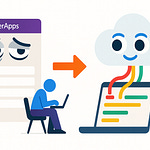
Have you ever spent days wiring together the pieces of a cloud app — databases, APIs, queues, monitoring hooks — only to pause and wonder if it all actually holds together the way you think it does? That kind of configuration sprawl eats up time and energy in almost every team. In .NET 10, a new orchestration layer aims to simplify that process and reduce uncertainty by centralizing how dependencies and telemetry are connected. If you’re exploring this release, check product docs to confirm whether this orchestration layer ships in-box with the runtime, as a CLI tool, or a separate package — the delivery mechanism matters for adoption planning.
Why introduce a layer like this now? Developers have always been able to manage connection strings, provisioned services, and monitoring checks by hand. But the trade-off is familiar: keeping everything manual gives you full visibility but means spending large amounts of time stitching repetitive scaffolding together. Relying too heavily on automation risks hiding the details that you’ll need when something breaks. The orchestration layer in .NET 10 tries to narrow that gap by streamlining setup while still exposing the state of what’s running, so you gain efficiency without feeling disconnected when you need to debug.
In practice, this means you can define a cloud application more declaratively. Instead of juggling multiple YAML files or juggling monitoring hooks separately, you describe what your application depends on — maybe a SQL database, a REST API, and a cache. The system recognizes these services, knows how to register them, and organizes them as part of the application blueprint. That doesn’t just simplify bootstrapping; it means you can see both the existence and status of those dependencies in one place instead of hopping across six different dashboards. The orchestration layer serves as the control surface tying them together.
The more interesting part is how this surface interacts with diagnostics. Because the orchestration layer isn’t just a deployment helper, it listens to diagnostic insights. Illustrative example: if database latency drifts higher than its baseline, the signal doesn’t sit buried in log files. It shows up in the orchestration view as a dependency health warning linked to the specific service. Rather than hunting through distributed traces to spot the suspect, the orchestration layer helps you see which piece of your blueprint needs attention and why. That closes the gap between setting a service up and keeping an eye on how it behaves.
One way to describe this is to compare it to a competent project manager. A basic project manager creates a task list. A sharper one reprioritizes as soon as something changes. The orchestration layer works in a similar spirit: it gives you context in real time, so instead of staring at multiple logs or charts hoping to connect the dots, you’re told which service is straining. That doesn’t mean you’re off the hook for fixing it, but the pointer saves hours of head-scratching.
For developers under constant pressure, this has real workflow impact. Too often, teams discover issues only after production alerts trip. With orchestration tied to diagnostics, the shift can be toward a more proactive cycle: deploy, observe, and adjust based on live feedback before your users complain. In that sense, the orchestration layer isn’t just about reducing setup drudgery. It’s about giving developers a view that merges configuration with real-time trust signals.
Of course, nothing comes completely free. Pros: it reduces configuration sprawl and connects diagnostic insights directly to dependencies. Cons: it introduces another concept to learn and requires discipline to avoid letting abstraction hide the very details you may need when troubleshooting. A team deciding whether to adopt it has to balance those trade-offs.
If you do want to test this in practice, start small. Set up a lightweight service, declare a database or external dependency, and watch whether the orchestration layer shows you both the status and the underlying configuration details. If it only reports abstract “green light” or “red light” states without letting you drill down, you’ll know whether it provides the depth you need. That kind of small-scale experiment is more instructive than a theoretical feature list.
Ultimately, productivity in .NET 10 isn’t about typing code faster. It’s about removing the guesswork from how all the connected components of an application are monitored and managed. An orchestration layer that links configuration, health, and diagnostics into a consistent view represents that ambition: less time wiring pieces together, more time making informed adjustments.
But building apps has another layer of complexity beyond orchestration. Once your services are configured and healthy, the surface you expose to users and other systems becomes just as important — especially when it comes to APIs that explain themselves and enforce their own rules.
Blazor, APIs, and the Self-Documenting Web
Blazor, APIs, and the Self-Documenting Web in .NET 10 bring another shift worth calling out. Instead of treating validation, documentation, and API design as separate steps bolted on after the fact, the framework now gives you ways to line them up in a single flow. Newer APIs in .NET 10 make it easier to plug in validation and generate OpenAPI specs automatically when you configure them in your project. The benefit is straightforward: your API feels more like a live contract—something that can be read, trusted, and enforced without as much extra scaffolding.
Minimal API validation is central to this. Many developers have watched mangled inputs slip through and burn days—or weeks—chasing down errors that could have been stopped much earlier. With .NET 10, when you enable Minimal API validation, the framework helps enforce input rules before the data hits your logic. It isn’t automatic or magical; you must configure it. But once in place, it can stop bad data at the edge and keep your core business rules cleaner. For your project, check whether validation is attribute-based, middleware-based, or requires a separate package in the template you’re using. That detail makes a difference when you estimate adoption effort.
Automatic OpenAPI generation lines up beside this. If you’ve ever lost time writing duplicate documentation—or had your API doc wiki drift weeks behind reality—you’ll appreciate what’s now offered. When enabled, the framework can generate a live specification that describes your endpoints, expected inputs, and outputs. The practical win is that you no longer have to build a parallel documentation process. Development tools can consume the spec directly and stay in sync with your code, provided you turn the feature on in your project.
The combination of validation and OpenAPI shouldn’t be treated as invisible background magic—it’s more like a pipeline you choose to activate. You define the rules, you wire up the middleware or attributes, and then the framework surfaces the benefits: inputs that respect boundaries, and docs that match reality. In practice, this turns your API into something closer to a contract that updates itself as endpoints evolve. Teams get immediate clarity without depending on side notes or stale diagrams.
Think of it like a factory intake process. If you only inspect parts after they’re assembled, bad components cause headaches deep in production. But if you check them at the door and log what passed, you save on rework later. Minimal API validation is that door check. OpenAPI is the real-time record of what was accepted and how it fits into the build. Together, they let you spot issues upfront while keeping documentation current without extra grind.
Where this gets more interesting is when Blazor enters the picture. Blazor’s strongly typed components already bridge backend and frontend development. When used together, Blazor’s typed models and a self-validating API reduce friction—provided your build pipeline includes the generated OpenAPI spec and type bindings. The UI layer can consume contracts that always match the backend because both share the same definitions. That means fewer surprises for developers and fewer mismatches for testers. Instead of guessing whether an endpoint is still aligned with the docs, the live spec and validation confirm it.
What matters most here is the system-level benefit. Minimal API validation catches data drift before it spreads, OpenAPI delivers a spec that stays aligned, and Blazor makes consumption of those contracts more predictable. Productivity doesn’t just come from cutting lines of code. It comes from reducing the guesswork about whether each layer of your app is speaking the same language.
These API improvements are part of the same pattern: tighter contracts, clearer signals, and less accidental drift between frontend and backend. And once you connect them with the diagnostics, orchestration, and security shifts we’ve already covered, you start to see something bigger forming. Each feature extends beyond itself, leaving you less with isolated upgrades and more with a unified system that works together. That brings us to the broader takeaway.
Conclusion
.NET 10 isn’t just about new features living on their own. It’s moving toward a platform that makes self-healing patterns easier to implement when you use its telemetry, security, and orchestration features together. The pieces reinforce one another, and that interconnected design affects how apps run and adapt every day.
To make this real, audit one active project for three things: whether templates or packages expose AI and telemetry hooks, whether passkeys or WebAuthn support are built-in or require extras, and whether OpenAPI with validation can be enabled with minimal effort.
If you manage apps on Microsoft tech, drop a quick comment about which of those three checks matters most in your environment — I’ll highlight common pitfalls in the replies.
In short: .NET 10 ties the pieces together — if you plan for it, your apps can be more observable, more secure, and easier to run.


