


Let me start with a confession: Not so long ago, I considered Microsoft 365 analytics to be an endless shuffle between bland Excel exports and barely-there built-in reports. Then—by accident, as most discoveries go—I stumbled on Microsoft Graph API, and suddenly those chaotic islands of data started singing in harmony. If you’ve ever wished for a backstage pass that lets you peek behind the curtains of Teams, SharePoint, and Outlook all at once, you’re about to find your answer. Buckle up for a guided tour with a few surprising pit stops along the way.
From Fragmented Data to a Connected Story: Breaking the Microsoft 365 Silo Trap
Last Tuesday, I spent an entire hour pulling metrics from Teams and SharePoint for our quarterly report. After carefully organizing everything in Excel, I realized something frustrating – the data didn't "talk" to each other. I couldn't tell which team conversations led to document changes. An hour wasted.
Sound familiar?
The Problem: Data Islands
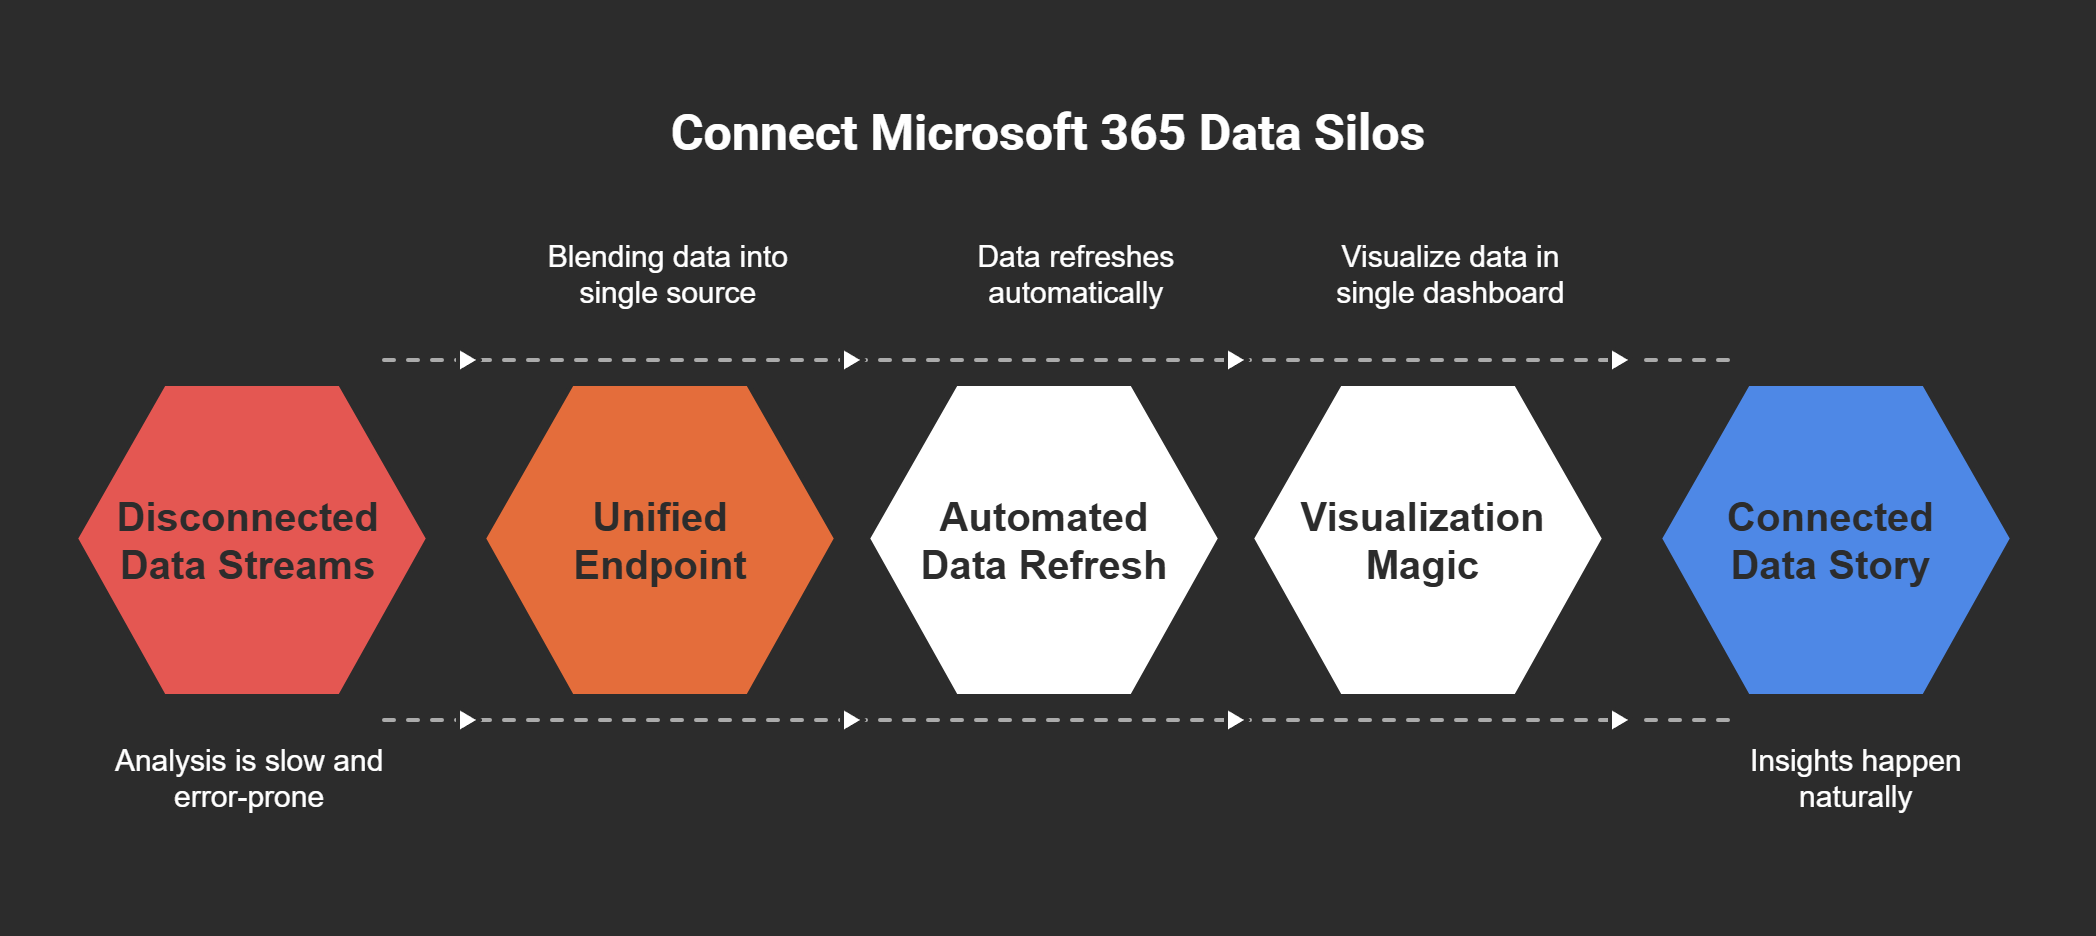
What's really happening in most organizations is pretty simple: disconnected data streams make analysis painfully slow and error-prone. Your Teams metrics live in one place. SharePoint analytics hide in another. Outlook data? That's a third silo entirely.
It's like trying to solve a puzzle while keeping each piece in different rooms.
Enter Graph API: Your Digital Master Key
This is where Microsoft Graph API makes its grand entrance. Its promise? A unified endpoint, blending Teams, SharePoint, Outlook, and more into a single source. Think of it as the master key to your digital workplace.
"A single source of truth is the first step to insightful analysis." – Satya Nadella
And Satya's right. When your data flows together, insights happen naturally.
Practical Impact: Real-World Benefits
The practical impact is immediate: bye-bye manual spreadsheets—hello transparency. Here's what happens when you implement Graph API:
You save hours previously spent jumping between admin centers
Your data refreshes automatically instead of becoming outdated
Errors from manual copying disappear
Patterns emerge that were previously invisible
Visualization Magic
Imagine visualizing Teams usage and SharePoint activity together in a single Power BI dashboard. Suddenly, you can see which departments collaborate most effectively and which ones struggle with document workflows.
For example, you might discover your marketing team's heavy Teams usage directly correlates with faster document approvals in SharePoint. Or that sales reps who participate in specific channels close deals 15% faster.
These aren't just statistics. They're stories about how your organization actually works.
The Unexpected Bonus
Here's an unexpected perk I discovered: conversations from Teams can help troubleshoot why SharePoint files are stuck in review. When a document sits unmodified for days, you can trace back to see if the team discussed blockers or concerns.
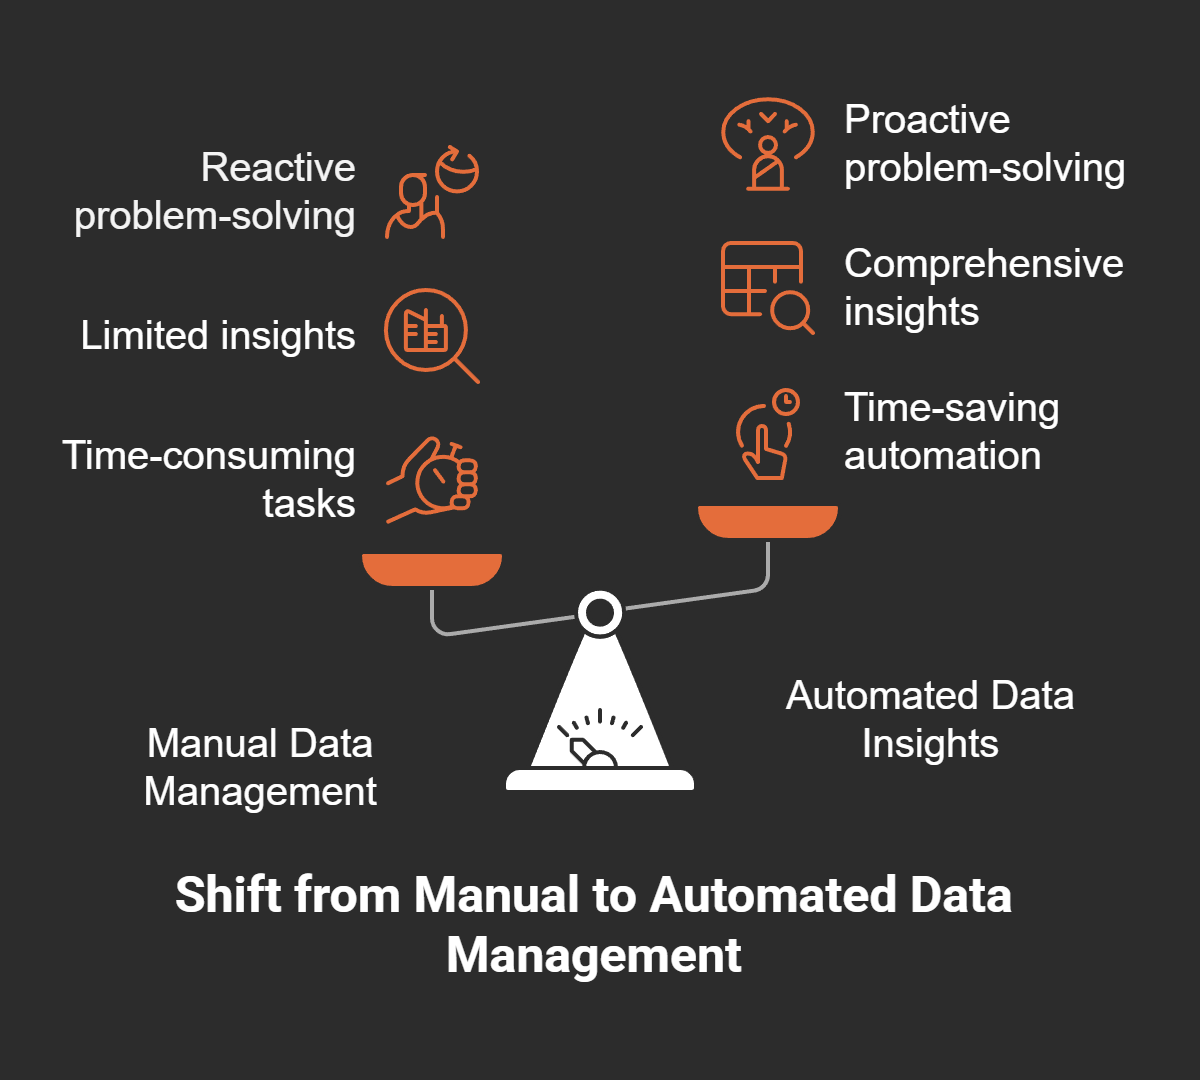
Before Graph API, these connections remained hidden. After? Problem-solving becomes proactive rather than reactive.
Microsoft 365 is packed with valuable data. But that value multiplies exponentially when you connect the dots between platforms. Graph API isn't just a technical tool—it's the storyteller that transforms fragmented data points into a coherent narrative about your organization's digital life.
Under the Hood: What Can You Really Dig Out with Microsoft Graph API?
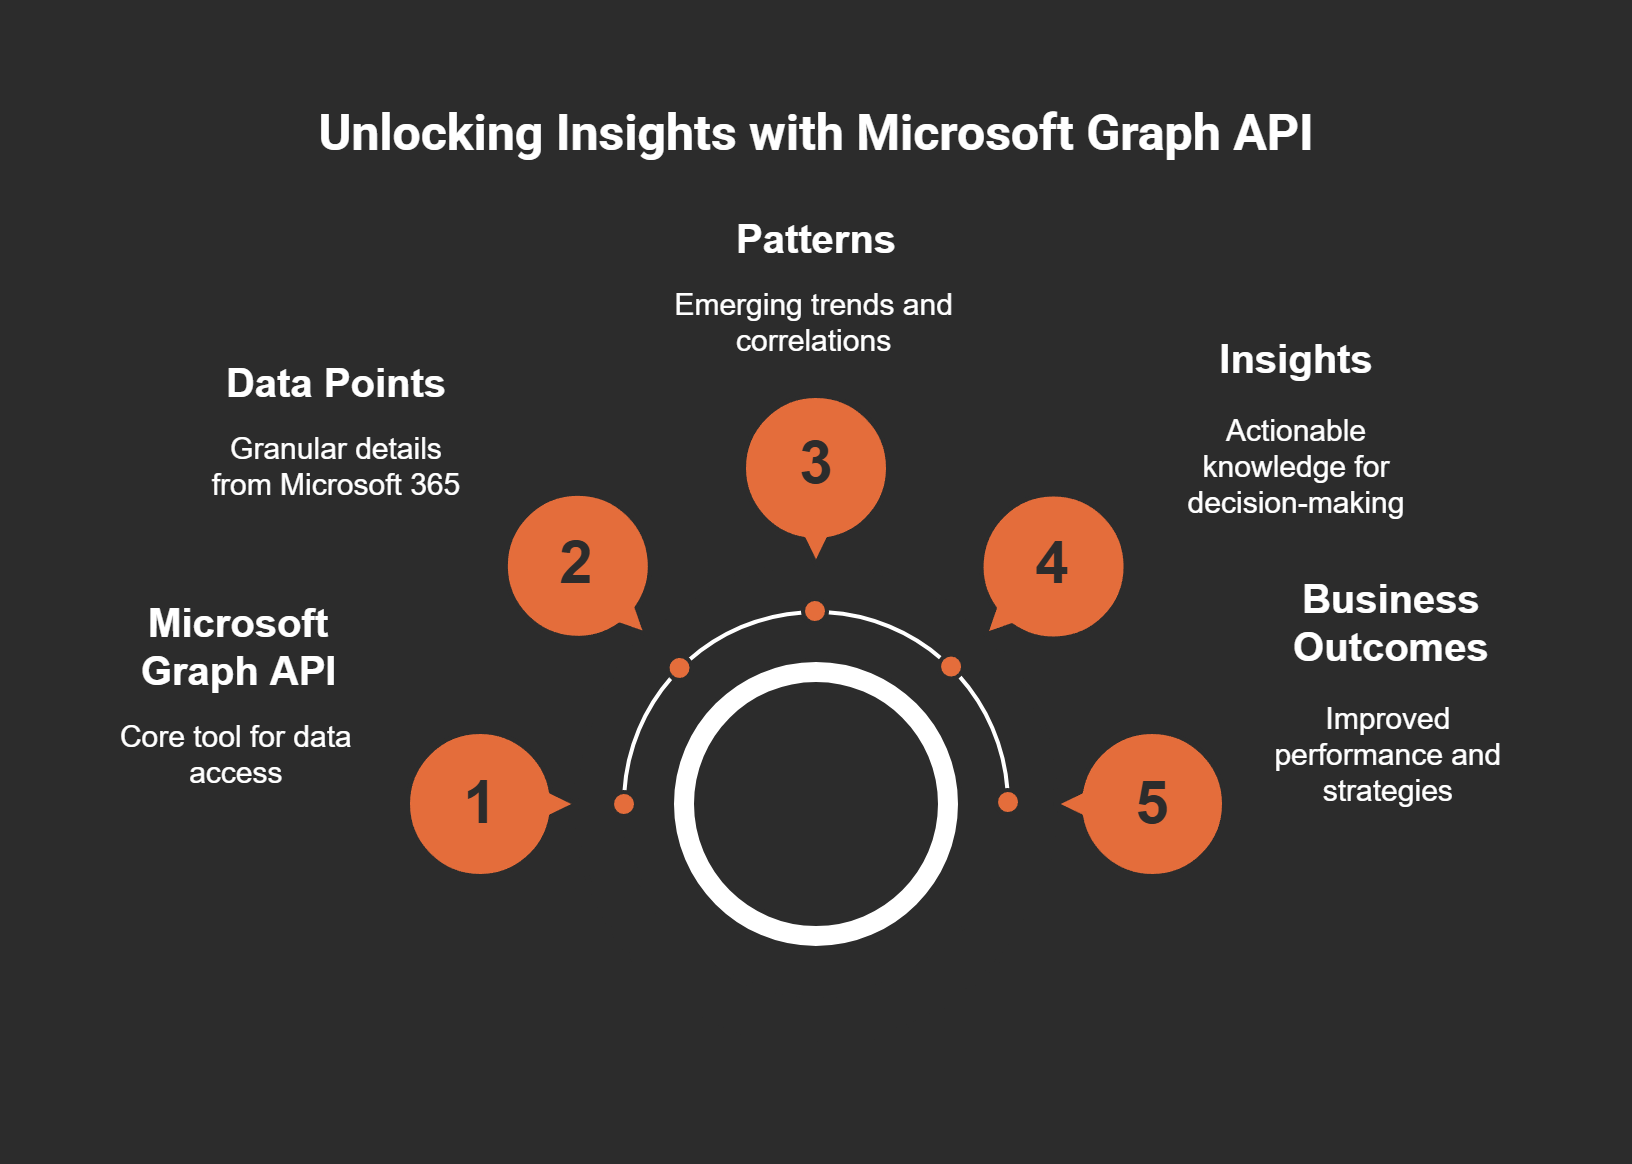
Ever wondered just how deep the Microsoft Graph API rabbit hole goes? The answer might surprise you. It's incredibly granular – we're talking details you probably didn't even know existed in your Microsoft 365 environment.
A Treasure Trove of Data Points
Think of Graph API as your digital detective. It uncovers everything from who actually showed up to that Teams meeting (not just who said they would) to tracking exactly when and how often someone edited that crucial SharePoint document.
In Teams: Channel activity, meeting attendance, message patterns, and even engagement metrics
Within SharePoint: File uploads, edit histories, sharing patterns, and who's accessing what
From Outlook: Email volumes, response times, and communication flows
Remember those tedious hours spent copy-pasting email response data from Outlook? Yeah, those are gone. Now it's automatic and accurate. One API call, and you've got it all.
Finding Hidden Patterns
Here's something I've seen: A marketing manager was quietly "stalking" reply times to priority clients through Graph API. She noticed something interesting – faster response times to certain clients correlated with higher sales win rates. Nobody saw that pattern before because nobody had the data.
As Satya Nadella wisely put it:
"The best insights are tucked between the lines of your operational data."
The real magic happens when you connect these data points. Imagine tracking SharePoint editing spikes during major Teams rollouts. Suddenly, you see how collaboration truly flows through your organization. The workflow patterns emerge like invisible ink under a blacklight.
Beyond Microsoft's Boundaries
The delight comes when you start pairing this data with external systems. Link customer emails from Outlook with your CRM data, and you'll see the full customer journey – from first contact to closed deal.
With just a few API calls, you can unlock patterns that were previously invisible:
Seasonality: When do communication patterns spike or dip?
Engagement: Which teams are collaborating effectively?
Performance indicators: How do communication patterns tie to business outcomes?
Having all this at your fingertips doesn't just save time – it transforms how you understand your business. You're no longer making decisions based on guesswork or isolated metrics. You're seeing the complete picture, with all its complexities and correlations.
And the best part? This isn't static data. It's dynamic, refreshable, and ready to reveal the ever-changing patterns of your organization's digital life.
Lights On, Hands Off: Automating Insights With Graph API and Power BI
Remember those days when you'd spend hours copy-pasting data into Excel spreadsheets? Yeah, those painful days are over. Now you can let Power BI gobble up your Microsoft 365 data live, directly from the source.
The "Set It and Forget It" Magic
The real game-changer happens when you automate everything. Graph API lets you establish recurring data pipelines that refresh on their own schedule - hourly, daily, weekly, whatever your needs demand.
As Satya Nadella wisely put it:
"You want your data working for you, not the other way around."
And he's absolutely right. Why waste precious hours manually updating reports when the machines can do it for you?
Real-World Automation Success
I recently saw a team completely transform their meeting culture after setting up automated reporting. Their Graph API pipeline flagged a pattern of video-call drop-offs during certain time slots. Armed with this insight, they optimized their meeting schedule and saw engagement jump almost immediately.
The beauty? They didn't have to hunt for this problem - the data served it right up.
What You Can Monitor Automatically
Teams data: Meeting attendance, message volume, channel activity
SharePoint metrics: File checkout durations, document collaboration
Outlook patterns: Response rates, communication volumes
The system watches for shifts in engagement, departmental trends, and even seasonal patterns - all without you lifting a finger. It's like having a tireless analyst working 24/7.
Let the Alerts Come to You
Perhaps my favorite feature? Auto-alerts. Never miss a concerning dip in customer response times or a sudden spike in file sharing again. Power BI can notify the right people when something needs attention.
Instead of hunting for problems (who has time for that?), you get automatically served the most urgent stories. The system essentially says, "Hey, look at this unusual pattern!" before it becomes a full-blown issue.
The End Result: Intelligence, Not Just Data
By connecting Graph API with Power BI, you transform what was once a manual reporting nightmare into an automated insight machine. Your data refreshes itself. Your dashboards update themselves. Your alerts trigger themselves.
You're free to focus on what actually matters - making smart decisions based on those insights rather than spending valuable time just trying to gather them.
And isn't that the whole point? When your Microsoft 365 data works for you instead of making you work for it, you've unlocked its true hidden value.
The Security Flip Side: Don't Get Burned By Your Own Master Key
Think of Microsoft Graph API as that Swiss Army knife in your drawer. Incredibly useful? Absolutely. But leave it lying around, and suddenly anyone can slice and dice your data. Not exactly a comforting thought, right?
The Double-Edged Sword of Access
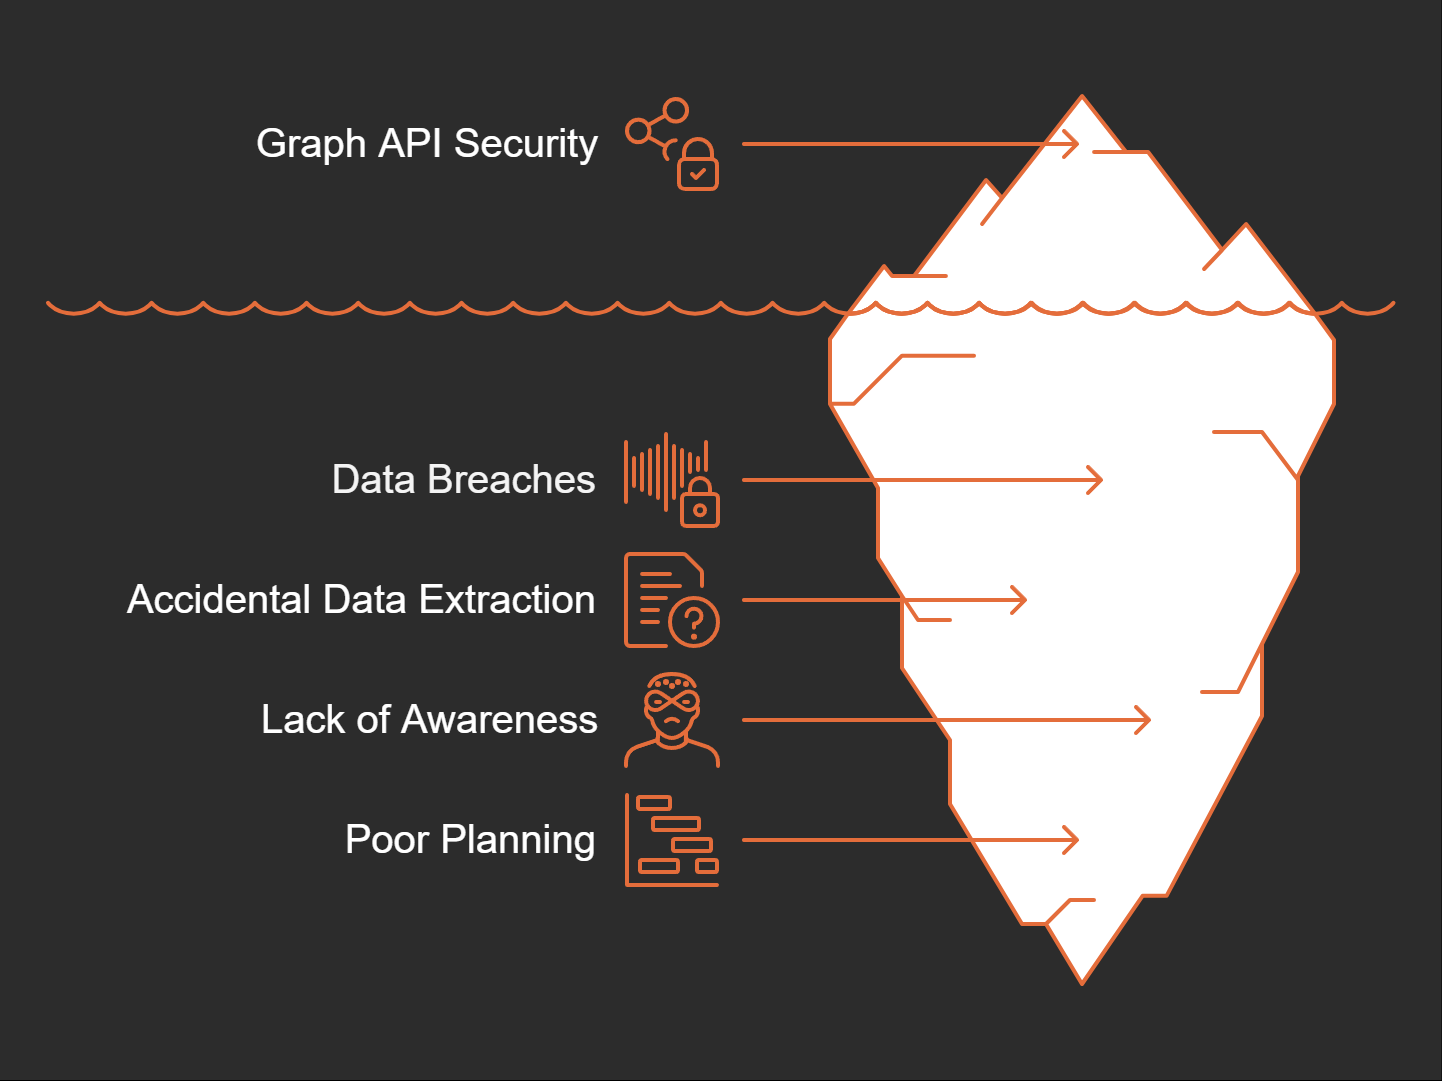
With a single endpoint providing access to your organization's digital crown jewels, security isn't just important—it's non-negotiable. And yet, I've seen too many implementations where security feels like an afterthought.
As Satya Nadella aptly put it:
"With great power comes great responsibility—for your data too."
The Principle of Least Privilege
Here's a rule I live by: only grant the exact permissions an application needs. Nothing more, nothing less. Think of it like hiring a contractor—you don't hand over keys to every room in your house when they only need to work in the kitchen.
Need to read calendar events? Grant only calendar read permissions.
Building an email app? Don't ask for access to Teams data too.
Creating a file manager? Define precisely which document libraries need access.
Security Best Practices That Actually Work
Let's be practical about this. Here are the non-negotiables:
Regular permission audits - Schedule monthly reviews of which apps have access to what data.
Secure token storage - Never, ever store tokens in code or config files. Use Azure Key Vault instead.
Active monitoring - Leverage Azure AD's auditing tools to watch for suspicious access patterns.
Understand permission types - Know the difference between delegated permissions (user context) and application permissions (runs without a user).
When Good APIs Go Bad: Cautionary Tales
I've witnessed firsthand what happens when organizations get sloppy with Graph API security. One midsized company granted their reporting app full mailbox access when it only needed basic profile information. Six months later? An intern accidentally extracted senior management's private emails.
Nobody wants to be that headline: "Company Leaks Sensitive Data Through Poorly Configured API."
Beyond Passwords
That 25-character password with symbols, numbers, and hieroglyphics? Not enough anymore. Your API tokens deserve better protection:
Implement certificate-based authentication where possible
Rotate secrets regularly
Use managed identities in Azure to eliminate stored credentials altogether
Stay curious about what Graph API can do, but stay equally cautious. Treat your API access like a bank vault key, not like the spare for the office fridge that everyone knows is hidden under the plant.
Remember: in the world of data, convenience without security is just a data breach waiting to happen.
When Microsoft 365 Isn't Enough: Blending External Data for Deeper Business Intelligence
Ever stared at your Microsoft 365 dashboards and thought, "This is helpful, but it's only part of the story"? You're not alone.
Microsoft 365 gives you plenty of data about what's happening inside your digital workspace. But real business insights don't exist in a vacuum.
Breaking Down Data Barriers
Here's where Graph API truly shines. It doesn't just connect Microsoft tools—it creates bridges to your entire digital ecosystem.
Have you ever wondered if project delays correlate with Monday-morning email traffic? Or if certain Teams channels see more activity right before missed deadlines?
Now you can find out. Graph API lets you blend Outlook communication patterns with project management data from platforms like Jira or Monday.com.
"The true value emerges at the intersections of your data sets." – Satya Nadella
And Satya's right. The magic happens where different data sources overlap.
The Power Couple: Graph API + Power BI
Together, these tools create a business intelligence powerhouse. You can easily pull in:
CRM data from Salesforce or HubSpot
Financial metrics from QuickBooks
HR information from your talent management platform
Website analytics from Google Analytics
Project timelines from Jira or Asana
Suddenly, Power BI becomes your central intelligence hub—not just for Microsoft data, but everything that matters to your business.
Real-World Applications
Financial firms are already leveraging this capability. They map Outlook communication patterns against client satisfaction scores to identify which accounts need more attention.
Manufacturing companies overlay Teams activity with production metrics to spot collaboration bottlenecks affecting output.
Marketing teams combine SharePoint document activity with campaign performance data to optimize content workflow.
From Reactive to Predictive
The most exciting part? Your dashboards transform from "what happened" to "what's likely coming next."
By merging diverse datasets, you can:
Spot early warning signs for workflow bottlenecks
Identify employees approaching burnout before it happens
Predict potential sales dips based on communication patterns
Forecast resource needs by correlating multiple data points
Cross-platform overlays highlight hidden efficiencies—or painful bottlenecks—you'd never see otherwise.
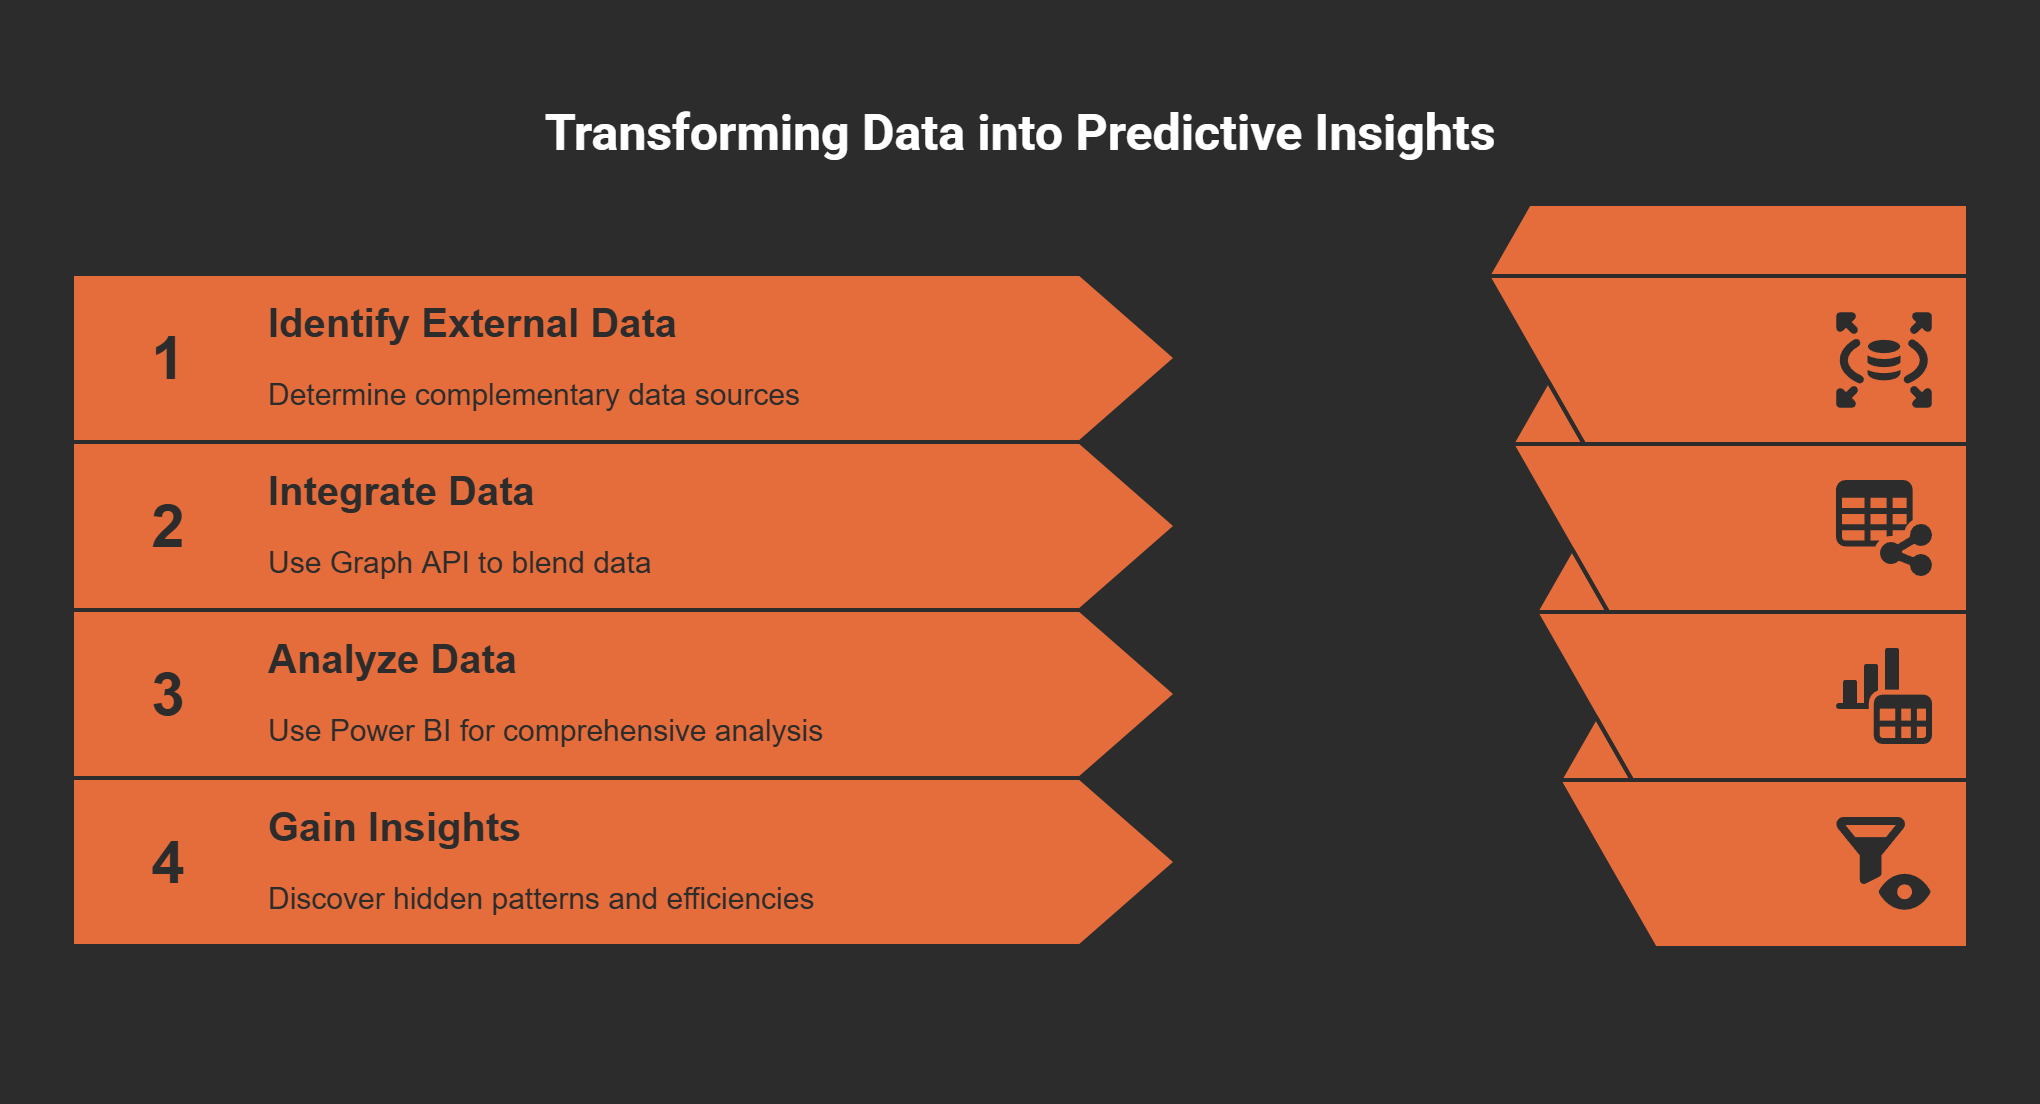
Getting Started With Data Blending
Begin by identifying which external data sources would complement your Microsoft 365 insights. Sales data? Project timelines? Customer feedback?
Then use Graph API to pull your Microsoft data alongside these external sources into Power BI. The integration possibilities are virtually limitless.
Remember, isolated data tells incomplete stories. But when you connect the dots across platforms, that's when you discover the insights that drive real business transformation.
Outperform Built-In Analytics: Unleashing Custom Reports Tailored to You
Ever felt trapped by Microsoft's built-in analytics? You're not alone.
Take Sarah, an IT manager who struggled with clunky Teams Admin Center exports for months. After switching to Graph API, she built a dashboard that tracked not just boring login data, but actual user engagement patterns. Her big discovery? A mysterious activity spike every Friday at 2pm. The culprit? Free pizza day in marketing. This isn't just amusing – it revealed real engagement patterns that standard analytics could never catch.
Why Custom Reports Matter
Standard Microsoft 365 analytics tools are like fast food – convenient but ultimately unsatisfying. They offer high-level summaries (total users, messages sent) but lack the nutritional value of detailed insights.
With Graph API, you can:
Measure what actually matters to your organization – cross-platform sentiment analysis, process inefficiencies, or customer engagement metrics that standard reports ignore
Drill down to granular details instead of being stuck with generic overviews
Cross-reference data sources to discover hidden relationships
As Satya Nadella aptly puts it:
"Custom reports are the home-cooked meals of business intelligence: tailored, memorable, and always more satisfying."
Beyond Static Reports: Dynamic Intelligence
Imagine overlaying SharePoint activity logs with Outlook traffic to anticipate exactly when workflows get bottlenecked. Is it Monday mornings? After board meetings? Graph API makes these connections visible.
One manufacturing company discovered their approval processes stalled every third Thursday – coinciding perfectly with their executive committee meetings. This insight helped them restructure workflows to maintain momentum.
The Magic of Automation
Perhaps the biggest game-changer? Automation. Your custom dashboards can automatically refresh – daily or even in real-time – freeing you from the endless cycle of data collection.
You'll spend less time wrangling spreadsheets and more time analyzing for business outcomes. Think about it: what could you accomplish if you reclaimed those hours spent on manual reporting?
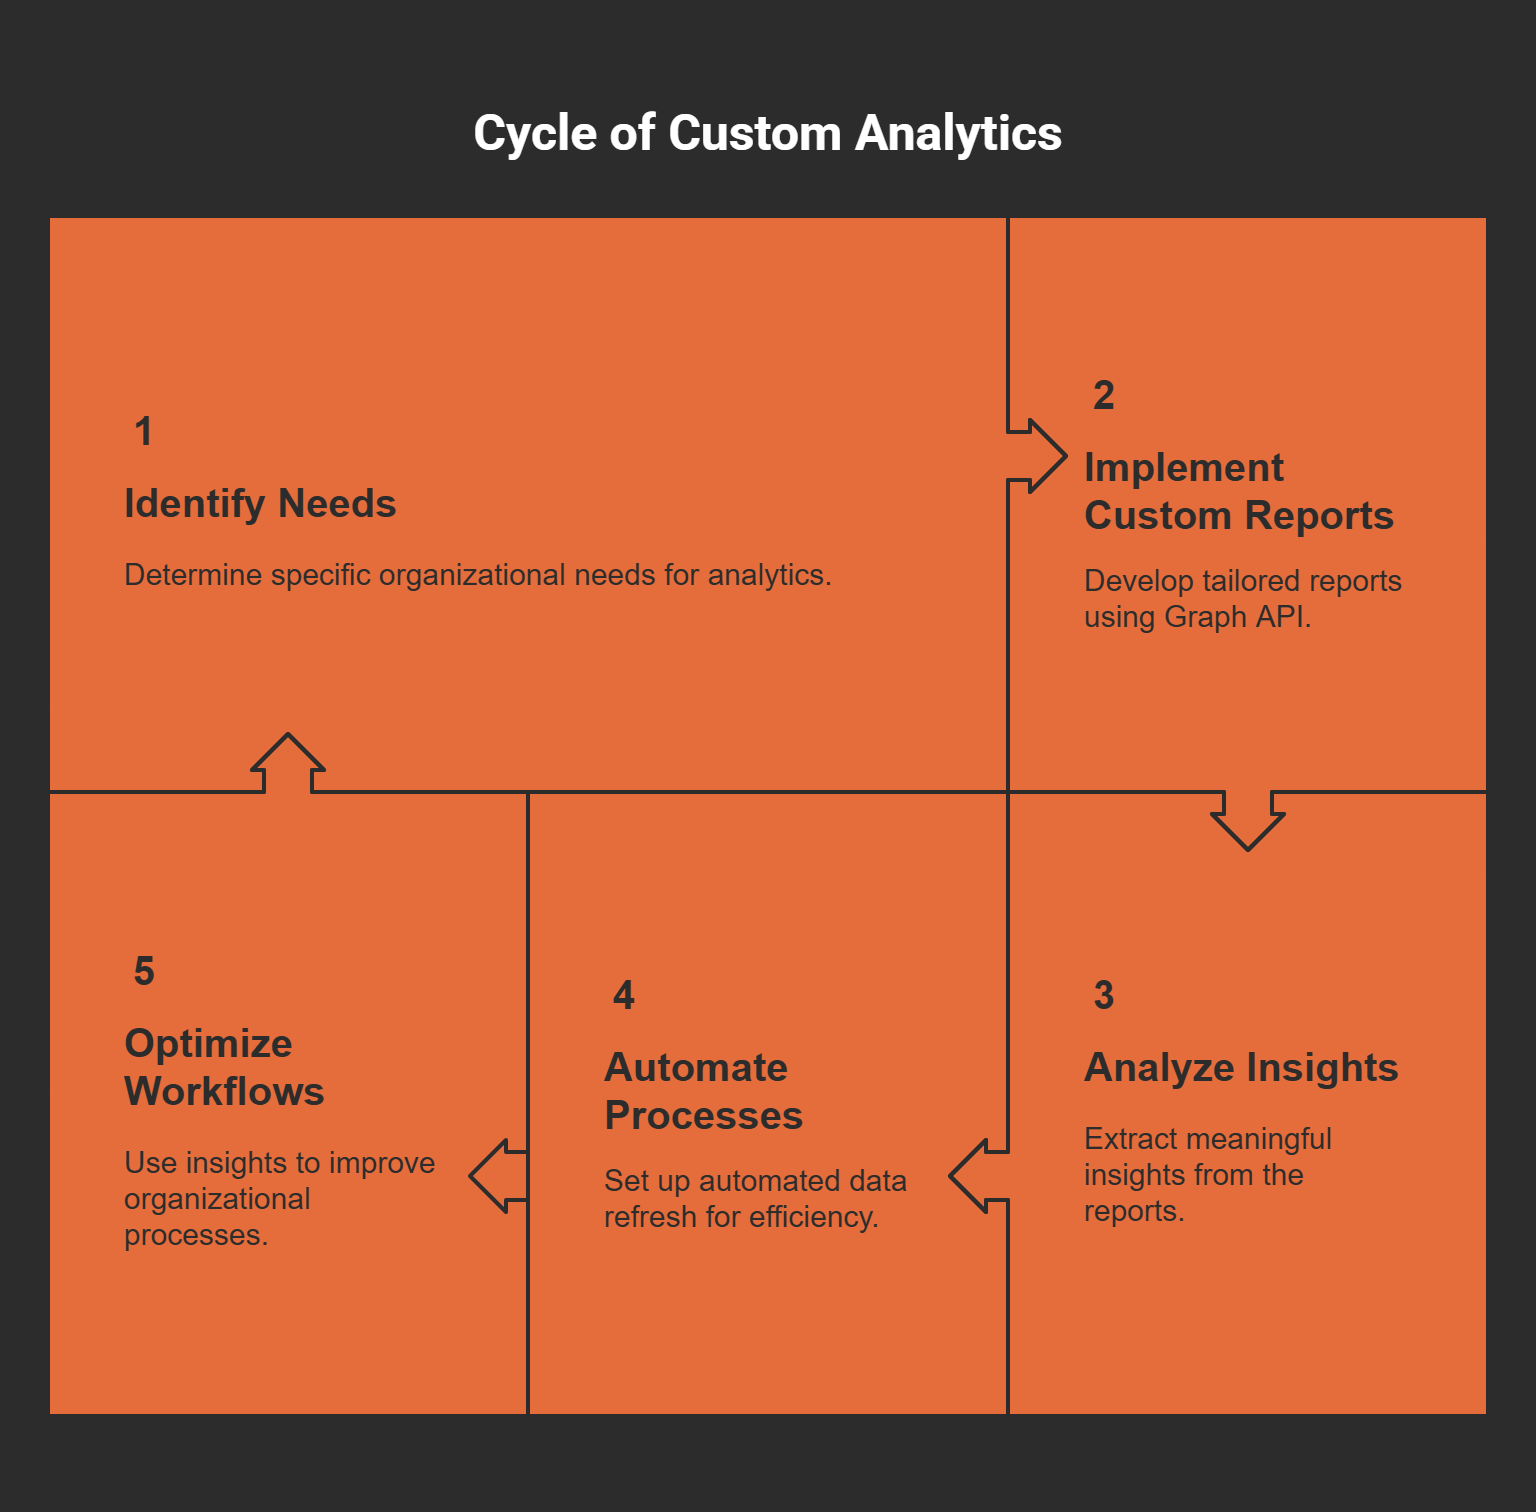
Getting Started With Custom Analytics
Graph API supports user-level detail that's simply unavailable in standard Microsoft 365 admin centers. This means you can:
Track individual user journeys across platforms
Identify your true power users (and potential champions)
Spot adoption challenges before they become problems
The best part? You don't need to be a coding genius. With tools like Power BI connecting to Graph API, even moderately technical users can create powerful dashboards that would make data scientists jealous.
Ready to leave generic reports behind and discover what's really happening in your digital workplace?
Is the Graph API Future-Proof? Riding the Tsunami of Organizational Data
Imagine yourself surfing. Not on a regular wave, but on a monstrous, city-sized tsunami of information. That's essentially what businesses are facing right now. The International Data Corporation projects we'll be generating a mind-boggling 175 zettabytes of data annually by 2025. That's not just big—it's astronomically big.
Think your organization has data challenges now? You ain't seen nothing yet.
From Luxury to Necessity
Business intelligence has transformed. It's no longer the fancy analytics package that gives you a competitive edge. It's the life jacket that keeps you from drowning in the data deluge. Without it, you're essentially paddling with your hands in a digital ocean that's getting deeper by the minute.
As Satya Nadella puts it:
"The companies winning tomorrow are building unified intelligence today."
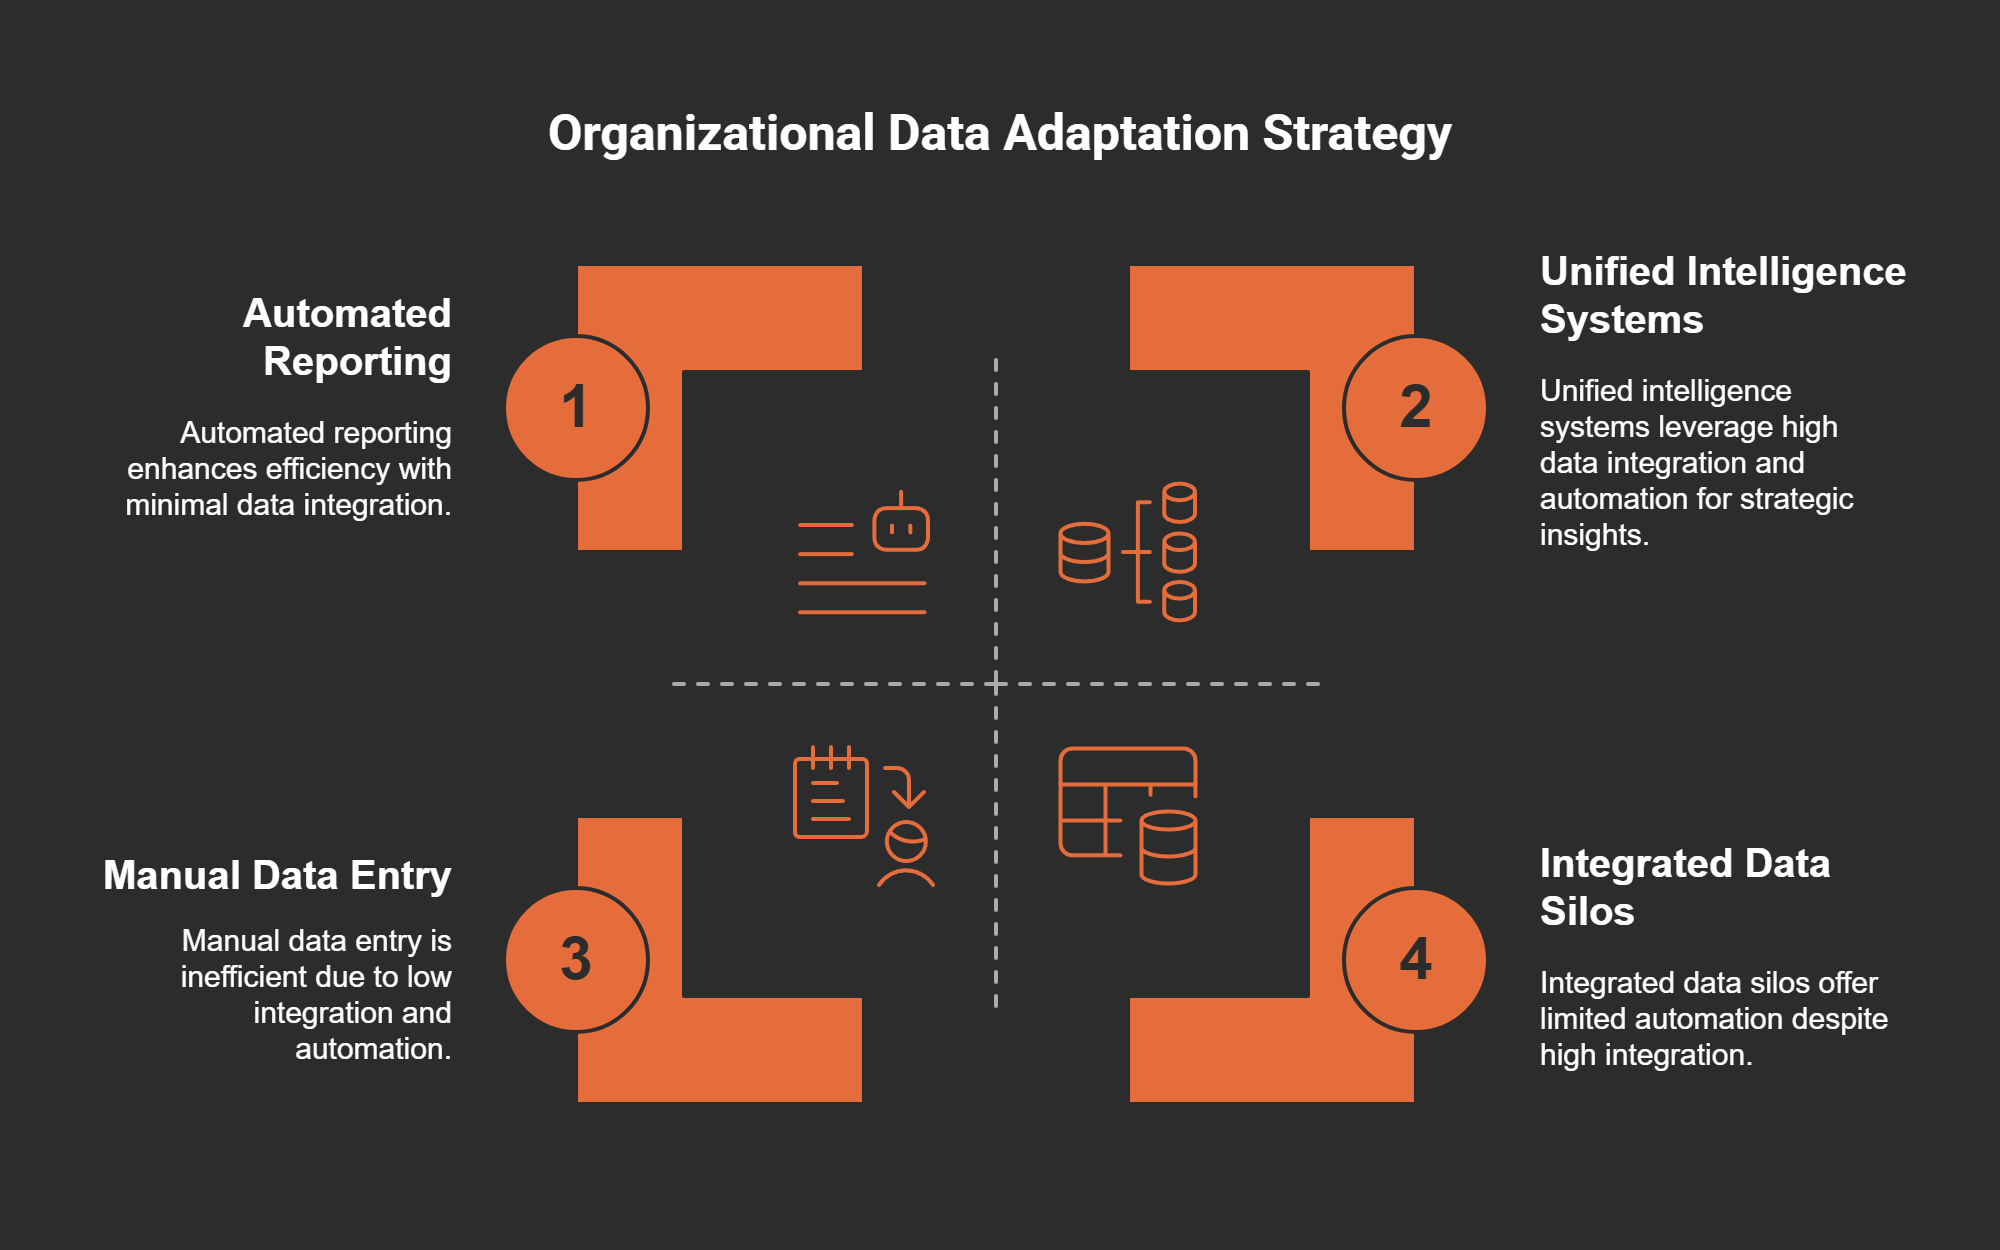
He's not wrong. The organizations that will survive this tsunami aren't the biggest or strongest—they're the ones that adapt by unifying and automating their reporting systems. The rest? They'll be buried under mountains of spreadsheets, struggling to make sense of disconnected information while their competitors sprint ahead.
Real-World Adaptation
This isn't hypothetical. Look at what's already happening:
Software development companies are syncing Teams collaboration metrics with Jira task completion rates, giving them unprecedented visibility into productivity patterns
Financial services firms cross-reference Outlook communication patterns with customer satisfaction scores, strategically timing their outreach for maximum impact
Healthcare providers correlate SharePoint document access with patient outcomes, identifying which resources actually improve care
The common thread? Graph API making these connections possible without complex, custom-coded integrations that break with every update.
The Career Differentiator
Here's something you might not expect: knowing Graph API isn't just for the IT department anymore. As automation becomes standard practice, the ability to harness organizational data through Graph API is becoming a career differentiator for:
Business analysts who can deliver insights without waiting for IT
Team leaders who can quantify productivity impacts
Project managers who can identify bottlenecks before they become problems
The future belongs to those who can ride this data wave rather than be crushed by it. Graph API isn't just another Microsoft tool—it's the surfboard that keeps you above water as the tsunami approaches.
With centralized access to all Microsoft 365 services, real-time analytics capabilities, and seamless external system integration, Graph API represents exactly the kind of unified, automated approach organizations will need to transform overwhelming data volumes into actionable intelligence.
The question isn't whether Graph API is future-proof. The question is: are you?


