

Many companies have trouble. They can’t combine different kinds of data. This data is for quick understanding. Data is often kept separate. This stops them from using real-time information. Translytical task flows fix this problem. They bring together different data in Microsoft Fabric. This special ability gives quick insights. It lets you act on data right away.
Making data write back in real-time is hard. You might have problems. Data might not be the same everywhere. It might not work with old systems. It might not grow easily. Translytical task flows in Fabric make these tasks easier. This changes everything. You get free and fast solutions. You can do it yourself. You can make a whole app. It can be right inside your Power BI report. This new Power BI tool is very useful. Data experts can use Fabric. They can make interactive data apps. This saves time. You can set up a basic translytical task flow. It takes less than one hour. This guide will show you how. You will build a working translytical task flow. It will use Fabric’s parts. This is for writing data back. You will make quick analytical workflows. These will give instant insights.
Key Takeaways
Translytical task flows mix data work and looking at it. They help you learn things fast. They also let you change data right away.
Microsoft Fabric helps make these flows. You can make a whole app. It can be inside a Power BI report.
You need to set up your Fabric workspace. Turn on special settings. These are for user data functions.
Make your Power BI report. Connect it to Fabric data. Use Direct Lake or Direct Query. This is for live updates.
Connect your user data function. Link it to a button in Power BI. Users can then use it. They can change data.
Prepare Your Fabric Environment
Configure Fabric Workspace
You need a Microsoft Fabric workspace. This is your main place. It keeps all your data projects. A trial capacity works fine. It is for your first setup. You can see all features. You do not need to fully commit. This helps you learn the system.
Set Permissions and Licenses
You must turn on certain settings. These are for your Fabric environment. They let you use special data tools. You need tenant admin access. First, sign in to Microsoft Fabric. Use an admin account. Then, click the Settings icon. Choose Admin portal. Next, pick Tenant settings. Find User data functions (preview). Open it up. Click the switch to turn it Enabled. This might take hours. It will become active. Turning this on is key. It is for translytical task flows. You also need to turn on Fabric database features. These help you handle your data. They are important for translytical data flows.
Install Necessary Tools
You will use your data. This is in Power BI Desktop. This tool helps make reports. Get the newest version. It links to your Fabric data. This link gives live updates. You can load sample data. This tests your setup. It makes sure data works. The system handles data well. It gives fast data access.
Build the Data and Function Layer
Create Fabric Data Store
You need a place for your data. Microsoft Fabric has many choices. You can pick a Fabric SQL Database. You can also use a Lakehouse or a Warehouse. At first, translytical task flows used SQL Database. Now, they work with Lakehouse and Warehouse. This gives you more ways to store data. For this guide, use a Fabric SQL Database. It is a strong and familiar place for your data.
Define Data Model for Write-Back
Next, plan your data model. This is how your data will look. For example, make a simple user table. This table will save sign-up info. It needs UserID, UserEmail, and SignUpDate. You can also make a table for comments. Or for target values. This table holds data users will change. Make sure your table fits your data. Use the right data types and lengths.
Load Sample Data
Put some test data into your new table. This helps you check your translytical task flow. You can add a few rows by hand. This lets you test your user data function later. Sample data makes sure your setup works. It confirms your data is ready.
Develop User Data Function
Now, make your user data function. This is a key part of Fabric. It holds the rules for your data actions.
Go to your Fabric workspace.
Choose “New” then “More options.”
Find “User data function.” Pick it. Give it a good name.
Link your user data function to your data source. Do this using “Manage connections.”
To link to a data source, use
@udf.connection. You can use it like this:
@udf.connection(alias=”<alias for data connection>”, argName=”sqlDB”)
@udf.connection(”<alias for data connection>”, “<argName>”)
@udf.connection(”<alias for data connection>”)The
argNameis the variable name. It is for the connection in your function. Thealiasis from ‘Manage connections’.Example:
# Where demosqldatabase is the argument name and the alias for my data connection used for this function
@udf.connection(”demosqldatabase”)
@udf.function()
def read_from_sql_db(demosqldatabase: fn.FabricSqlConnection)-> list:
# Replace with the query you want to run
query = “SELECT * FROM (VALUES (’John Smith’, 31), (’Kayla Jones’, 33)) AS Employee(EmpName, DepID);”

# [...] Here is where the rest of your SqlConnection code would be.

return results
Make a Warehouse in Microsoft Fabric. Or, use one in the same workspace.
Go to the Functions explorer. Click ‘Manage connections’.
In the side panel, click ‘+ Add’. This adds a new data link.
From ‘Get data’, pick a data source. Your function can already use this data.
Note the connection alias. It might be ‘myfabricwarehouse’.
Use this alias in your function code. Use
FabricItemInput(”alias-name”).
Write the rules for your user data function. You can use code help to start. Then, change it. Make it INSERT, UPDATE, or DELETE data. For signing up, use INSERT. Add checks. For example, check email format. Look for repeated emails. This makes your data good. Your translytical task flow gets stronger.
Test User Data Function
Test your user data function in Fabric. This checks if it works. You can run the function from Fabric. Give it test values. Look at the result. Make sure data is added or changed. Check your SQL Database. This step ensures your translytical logic works. It confirms your data actions are good.
Design the Power BI Write-Back Report
You will now build the interactive part. This is your translytical task flow. Users will work with your data here. You will use Power BI Desktop. It makes a report. This report connects to your Fabric data.
Connect Power BI to Fabric Data
Open Power BI Desktop. Connect it to your Fabric SQL Database. You can also use a Lakehouse or Warehouse SQL endpoint. Use Direct Lake or Direct Query mode. This gives real-time updates. Your report shows the newest data. It updates right when data changes.
Choosing Direct Lake or Direct Query is key. It changes how your report works. Direct Lake is faster. It gets data from OneLake. Direct Query gets data each time.
Follow these tips for best speed:
Upstream Data Preparation: Do hard data changes before Power BI. Do them in the data source.
Calculated Columns: Make calculated columns in the data layer. Do not use DAX-based calculated columns. This is for Direct Lake semantic models.
Incremental Refresh: Use incremental refresh at the ETL layer. This is for dataflows. It is between your source and end.
Partitioned Tables: Make Delta tables better. Do this by partitioning and ordering. Fabric lakehouses and warehouses use table partitioning.
Query Folding: Use query optimization. Do this with Dataflows Gen2. Avoid changes that stop query folding.
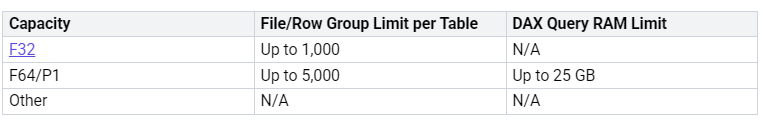
Sometimes, Direct Lake mode does not work well. This happens if you have too many files. Or, if you use too much memory. It also happens with views or tables. These have Row-Level Security (RLS). When this happens, your query might switch. It goes to DirectQuery. This is called DirectQuery fallback. Things will get much slower. DAX queries change to T-SQL. This takes longer to run. You can see this fallback. Look for a sudden slow down. You can also use Power BI Desktop’s Performance Analyzer. It checks for a SQL query step. This is in the visual’s run.
Design Report Layout
Design interactive elements for your report. You need text slicers. These are for user input. You also need buttons. They start actions. Think about what users need to see. Decide what they can do. For example, make a text slicer. It is for email input. Add a button. Label it “Submit.” Make sure the layout is clear. It should be easy to use.
Integrate User Data Function
Now, link your user data function to a button. This is a new Power BI feature.
Add a button to your report. Do this in Power BI Desktop.
In the Format button pane, find Action. Turn the Action switch On.
From the Type menu, pick Data function.
Give values for Workspace, Function Set, and Data function.
Once you pick the data function, parameters will show. These are the function’s inputs. For each parameter, pick a slicer. Do this from your report. Or, pick the Conditional formatting (fx) button. This lets you choose a data field. Or, a measure from your report.
Each parameter of your user data function must link. It links to an element in the Power BI report. These elements can be:
Button, list, or text slicers.
Data fields.
Measures.
Configure User Input
You need to link report elements. Link them to your user data function parameters. This lets users give input.
Slicers as input controls: You can use button, list, and text slicers. For button or list slicers, link them to a data field. Do this from the Data pane. Remove all visual interactions. Do this if they are only input controls. For text slicers, linking to a data field is optional. Link it only if you want to filter data.
Data fields or measures as input controls: You can also link these. Link them as parameters. Pick fields that match the input parameter type. For passing one primary key, like
CustomerID, useSELECTEDVALUE DAX. For example,SelectedCustomerID = SELECTEDVALUE(Customer[CustomerID]).
You can also use query parameters directly. Make a query parameter. Do this in Power Query. Use it to filter data. This is during loading. This lets the parameter change the data. It does this before it shows in the report. Dynamic M Parameters also help. They pass values from report elements. These go to M query parameters. This makes data filtering more interactive.
Display UDF Return Messages
Your user data function can show messages. These messages confirm success. Or, they show errors. This feedback is very important. It makes a good user experience. User data functions show messages well. They put success or error details. This is right in the Return statement. This message pops up. It shows after the function finishes. It is the main way to talk to the user. This also helps fix problems. Users can report the exact error.
You can also use more advanced feedback:
Status-Check Mechanism in Database: Send actions through a logging table. Or, a staging table. If a write works, log a success. If permission is denied, the write fails quietly. Power BI can then check this table. It shows a status. Like ‘Write successful’. Or ‘No recent write attempt’. This can be for each user.
Power Automate Integration: Start a Power Automate flow. Do this from a Power BI button. This flow can check for errors. It can check permissions. It can send error messages. Or, alerts via Teams or email. This makes things clearer.
You should also check user permissions. Do this before starting actions:
Check User Permissions Before Triggering: Check permissions. Do this in Power BI, Power Query, or Power Automate. Check user permissions. Do this before running the UDF.
Use Power Automate for Authorization: Make a Power Automate flow. Start it with a button click. Add a step. Check user permissions. Do this before calling the UDF. If not allowed, the flow can stop. It can send messages.
Error Handling in Power BI (DAX/Power Query): Use DAX or Power Query. Check user authorization. Do this before showing writeback options. Show a custom message. Or, turn off the button. Base this on user roles. Or, access levels. For example,
IF(HasUserPermission() = FALSE(), “You do not have permission to perform this action”, “Writeback to Fabric Warehouse”)gives visual feedback.Feedback in the User Interface (UI): Design custom visuals or buttons. These give clear feedback. This can show an error message. Or, turn off the button. Do this when a user cannot access. Use DAX and Power Automate.
You can also control button visibility. And messages. Base this on permissions:
Create a DAX Measure for User Permissions: Make a DAX measure. It checks if the user has permissions. Base this on roles. Or, a user table. Example:
UserHasPermission = IF(CONTAINS(UserPermissions[UserID], UserPermissions[UserID], USERNAME()), TRUE, FALSE).Set Button Action Based on Permission Check: Use the
UserHasPermissionmeasure. Do this in the button’sActionproperty. This controls UDF triggering. If the user lacks permission, set the action toNone. Or, show a message.Use a Dynamic Tooltip/Message: Set the button’s
tooltip. Or,dynamic text. This tells users about their permission. Example:ButtonMessage = IF([UserHasPermission] = TRUE(), “Click to writeback to Fabric Warehouse”, “You do not have permission to perform this action”).Provide Feedback on the Button Visibility: Set the
Visibleproperty of the button. Base this on the permission measure. Example:ButtonVisible = IF([UserHasPermission] = TRUE(), TRUE(), FALSE()). This shows or hides the button. It is based on access.
This full plan makes your translytical task flow strong. It gives clear feedback. It manages user interactions well.
Run Your Translytical Task Flow
You built your translytical task flow. Now, see it work. This part shows you how. You will publish your report. You will see the whole process. You will also check data changes. You will find fixes for problems.
Publish Power BI Report
Share your report. Publish your Power BI report. Put it in the Fabric workspace. Others can now see it.
Open your report. Use Power BI Desktop.
Click “Publish.” It is on the Home tab.
Pick your Fabric workspace. Choose from the list.
Confirm publishing.
Your report is now live. It is in the Fabric service. Users can open it. They can use your translytical task flow.
Demonstrate End-to-End Flow
Run your translytical task flow. See how it all works.
Open the Power BI report. It is in the Fabric service.
Find the input boxes. These are often text slicers.
Type new data. For example, an email.
Click the action button. This starts your user data function.
Watch the data update. It happens fast. The user data function runs. It writes data. It goes to your Fabric data store.
See the report change. It updates right away. It shows the new data. This finishes the translytical task flow. You see input become action. Then, it becomes insight.
Monitor Data Changes
Check if data changed. Look in the Fabric data store.
Go to your Fabric workspace.
Find your Fabric SQL Database. Or Lakehouse. Or Warehouse.
Open the SQL endpoint. Or query editor.
Write a simple query. Select data from your table. For example,
SELECT * FROM YourTableName;.Run the query. You will see the new data. You put it in the Power BI report. This means your translytical workflows work. Data is saved correctly.
Address Common Issues
You might have problems. This is when you run your translytical task flow. Here are fixes for common issues.
Power BI Connection Modes
Direct Lake/Query: These modes update fast. Your user data function writes data. Your report updates quickly. This is good for translytical workflows.
Import Mode: These reports need refreshes. This keeps them current. You can refresh a semantic model. Do this with a Fabric pipeline. Call this pipeline. Do it from your user data function. This makes translytical workflows work well.
To refresh a semantic model in Import Mode:
Make a new pipeline. Do it in your Fabric workspace.
Make sure it connects. Connect to your Power BI datasets.
Add ‘Semantic model refresh‘. Put it on the pipeline canvas. Find it in ‘Add pipeline activity’. Or ‘Activities’ bar.
Select the activity. Go to ‘Settings’ tab.
Choose a Power BI connection. Or make a new one. Give a name and login.
Pick the right Workspace and Dataset.
You can change settings. Like ‘Wait on completion’. Or ‘Max parallelism’. Or ‘Retry Count’. Also ‘Transactional’ or ‘Partial Batch’ refresh.
Set the output state. Any activity before it must be ‘successful’. This starts the refresh.
Save the pipeline.
Your user data function can call this pipeline. This will refresh your data. Your report will always show new data.
Troubleshooting Tips You might see errors. Errors in UDF running. Or connection problems. Or report display issues. Try these steps:
Check Refresh History: Go to Power BI Service. Look at the Refresh History. It often shows the error.
Credentials and Connections: Reconnect. Or re-enter your logins. Do this for data sources. Make sure they are right.
Data Gateway: You use a data gateway. Make sure it is installed. Make sure it is running. Update it often. Check data source settings. In Power BI Service, they must match Power BI Desktop. Use Manage Gateways. Test and fix problems there.
Power Query Steps: Remove extra columns. Remove rows you do not need. Do not use complex steps. In Power Query, they can stop refresh.
DAX Formulas:
Use Measures: Use measures for changing results. They change with filters. Do not use calculated columns.
Watch Your Filter Context: Totals might look wrong. Your DAX might ignore filters. Use
CALCULATE()to fix filters.Use Quick Measures or DAX Studio: Power BI Quick Measures help new users. Install DAX Studio. Test and fix complex DAX logic.
Break Down Formulas: Split long DAX expressions. Make them smaller parts. This makes them easier to read. Easier to test and fix.
Follow these steps. You can run your translytical task flow. You can fix problems. This makes sure your translytical workflows work well. They give good, real-time insights.
You now see the power. A translytical task flow is strong. It is in Microsoft Fabric. This makes data easy. It gives quick data insights. You get simple systems. User experience gets better. It saves money. Look at new ideas. Build tools for data info. Make systems for strange data. Send tickets from your report. Handle small data tasks. Use outside data tools. This links outside steps. You can use many tool calls. This makes things automatic. This link changes data work. Translytical ways help you. They change data use. This is in Fabric. A translytical task flow makes data useful. You can use many tools. This is for automation. This is a strong solution. This task flow handles data. You can use many tools. This is for data automation.
FAQ
What are translytical task flows?
Translytical task flows mix two things. They mix data processing. They also mix data analysis. You get quick insights. You can use your data right away. You can update information directly. This helps you make fast choices. It uses your data well. This is a new way. You can use your Power BI report.
Why should I use Microsoft Fabric for these flows?
Microsoft Fabric has many good points. It costs nothing. There is no waiting. You can build a full app. It is right in your Power BI report. This makes data easy to handle. It helps you work better. This report is very strong.
Can I use different data sources with translytical task flows?
Yes, you can. At first, these flows used Fabric SQL Database. Now, you can use Lakehouse. You can also use Warehouse. This gives you choices. You pick the best place for your data. Your report can link to these. This makes your report flexible.
How do I get feedback from my user data function in my report?
Your user data function can show messages. These messages show if it worked. Or if there was a problem. They pop up in your Power BI report. This gives you instant news. It helps you know what your data did. This makes your report very lively. You will see the results.
