

Do you have trouble? Do you make detailed reports? Do you make print-ready reports in Power BI? Regular reports are not perfect. They are not good for invoices. They are not good for legal papers. Reports can load slowly. This happens with fancy pictures. Paginated reports fix this. They are perfect. They are good for printing. Paginated reports make exact papers. They make neat papers. You can use them for daily tasks. You can use them for bills. You can use them for rules. Power BI paginated reports help a lot. They meet your exact needs.
Key Takeaways
Paginated reports are great. They make perfect documents. These are ready to print. Think invoices or legal papers.
Use Power BI Report Builder. Design these reports there. Connect them to your data.
Paginated reports work well. They handle lots of data. They keep your information safe.
You can share paginated reports. Publish them to Power BI Service. Others can see them.
Pick paginated reports. Do this when you need exact layouts. This is for printing or exporting.
Learning About Power BI Paginated Reports
You can make paginated reports with Power BI Report Builder. This tool helps you design them. It lets you control how they look.
Starting with Power BI Report Builder
First, get Power BI Report Builder. Install it on your computer. It is a separate program. It is not Power BI Desktop. It will seem familiar. This is true if you used SQL Server Reporting Services. The screen shows a design area. You drag and drop items here. You also set their options.
Connecting Data and Datasets
Next, link to your data. Power BI Report Builder works with many data sources. You can link to a Fabric warehouse. This is a Microsoft Azure SQL database. You can also link to SQL Server. Or Oracle. You can use ODBC data. You set up your connection string. Or, you can type it in.
After connecting, make datasets. These datasets say what data your report uses. You can write your own T-SQL queries. This gives you full control. You get only the data you need. This helps your report work fast. Make your queries good. Do not get too much data. Use parameters in your queries. This filters data at the start. Your report will run faster. You choose what fields to show. You do not have to show all fields.
Making Report Layouts
Designing the layout means making it perfect. You drag report items onto the design area. These include tables, matrices, and lists.
Tables and Matrices: These are like those in Power BI Desktop. Tables show data in rows and columns. Matrices sum up data.
Lists: Lists are very helpful. Think of a sales order report. You want each page to show one sales order. Each page also needs a table. This table shows sales order items. You can use a list for the sales order header. You set page breaks. Each page then has one sales order header. Inside that list, add a table. This table shows sales order lines. Not all sales orders have the same items. This table shows the details.
Text Boxes: Text boxes are better here. They are better than in Power BI Desktop. You can use expressions in them. These expressions find data. They also add custom HTML. This helps when exporting to Excel.
Rectangle Workaround: Sometimes, objects must stay put. This is true even if data above them changes. Use the “rectangle workaround.” Add a rectangle to your report. Put other objects inside it. Attach the rectangle to a top object. This keeps objects in place. This helps make layouts consistent.
Using Expressions and Parameters
Expressions and parameters make reports dynamic. They make them exact.
Expressions: Use expressions for advanced looks. Use them for calculations. The language is VB.NET. You can set font, color, bold, or italics. You can join everything together. HTML markup is powerful here. Use it in expressions for advanced looks. Remember to turn on HTML markup. Do this in the placeholder properties. This is a common mistake. Select the expression or object first. Then, right-click. Go to placeholder properties.
Parameters: Parameters let users change the report. They can filter data. They can change how the report looks. Make parameters in the parameters folder. Then, use them in your datasets. Or in your visuals. You can set default values. This is like a default slicer. You can also get parameter values from a query. This makes them change.
You should look at your reports. Check them in different ways. Exports can look very different. A good PDF report might not look good in Excel. This is true with merged cells. Or with layout changes. Knowing export needs early saves work.
Why Paginated Reports Matter
You may ask why you need paginated reports. They give many good things. They help you make exact papers. They make them look good. They also work with lots of data. These reports meet key needs in your business.
Print and Export Precision
Paginated reports let you control how papers look. You can put each item where you want. This makes reports look sharp. They look professional. Think of bills or project updates. They must look perfect. These reports are for printing. They make sure everything lines up. It lines up on each page. You will not see bad breaks. You will not see cut-off tables.
You can also share these reports easily. They let you export data many ways. You can send them as a PDF. This is good for emails. You can export them to Excel. This is for data study. This gives you choices. You choose how to share reports.
Large Dataset Handling
Paginated reports handle big data well. They break big data into small parts. These parts are easy to use. This helps you see all your data. This makes them a top choice. It is for businesses. You can make smart choices. These choices are based on clear data.
Paginated reports have limits. They limit how much data they can use. In a normal setup, things can slow down. This happens with over 1,000,000 rows. It happens with 15-20 columns. This limit can double. This is in better setups. To make it faster, group data. Do this in your query. Do it before the report sees data. Do not group data in the report.
Operational Reporting Needs
You use paginated reports for daily tasks.
For our “operational” needs we use paginated reports.
They are great for many papers:
Financial reports
Operational reports
Legal and regulatory documents
Paginated reports are used often. This is when data needs to be fixed. It needs to be structured. This includes bills. It includes financial papers. Or other business reports. They help you follow strict rules. These reports give perfect documents. They follow exact rules. This is key for rule makers. Groups use them for rules. This includes HIPAA or GDPR. They help you track rules. This makes sure you follow standards.
By using advanced power bi paginated reports, you can make steady papers. They are ready to print. These are key for checks. They are key for legal rules. They also help with boss reviews. This way makes sure reports give ideas. It also helps you meet legal duties. You follow strict safety rules. This is a main good thing. It is for power bi paginated reports.
Data Security and Access
Paginated reports have strong safety. They keep your data safe. They can use Row-Level Security (RLS). This uses rules. It limits who sees data. This works for users not logged in. You can send reports to outside people. They do not need to be in your groups. This lets one report help many people. Each person sees only their data. This uses ‘Anonymous Authentication with embedding‘.
For users logged in, paginated reports use RLS. This uses rules based on the user. You can limit data access. This is based on user names or groups. This means different users see only their data. They see it from one report.
Paginated reports run in a safe place. This makes them safer. This safe place talks to a trusted process. This is for data requests. This means your login info is not shown. Power BI also keeps networks separate. This includes Service Tags. It includes Private Links. These work for embedded reports. They work for APIs. Power BI uses Microsoft Entra ID for logging in. The system sends your login token. It goes to the Power BI Premium cluster. This gives each report its own safe spot.
Paginated reports use Single Sign-On (SSO). This uses Azure Active Directory (Azure AD) OAuth2. This works for DirectQuery datasets. When you turn this on, Power BI sends your Azure AD login details. It sends them to the data source. This lets the report follow safety rules. These rules are at the data source.
Paginated reports do not set up RLS. They get RLS rules from the data source. This could be a Power BI dataset. Or it could be an Analysis Services (SSAS) model. The RLS must be set up there.
To set up RLS in a paginated report:
Make parameters in the report.
Use the built-in field called UserID.
Put UserID in a filter.
Put UserID in a query.
Here are steps to use RLS:
Set RLS roles in your Power BI dataset. Do this in Power BI Desktop. Or do it in SSAS. Use DAX filters. These filters limit data. They limit it based on the user.
Publish the dataset to the Power BI Service. Give users their correct roles.
In Power BI Report Builder, link your paginated report to this dataset. The dataset must have RLS.
When you see or schedule the paginated report. Do it through the Power BI Service. It will follow RLS rules. It uses the logged-in user’s identity.
How to Make Paginated Reports
You can build paginated reports. It is a clear process. This guide shows you how. You will link data. You will design how it looks. You will use strong features.
Start with Power BI Report Builder
To make paginated reports, use Power BI Report Builder. This tool helps you design perfect papers. Follow these steps to begin:
Go to the Microsoft download page. Get Power BI Report Builder.
Follow the steps to install it. Put it on your device.
Open the program.
Log in with your Microsoft account.
Start making reports. Power BI Report Builder is your main tool.
Connect Data and Datasets
Next, link your data. Power BI Report Builder works with many sources. You can filter data. This saves time. It saves time if you use data again. Make data special for unique requests. This works for big or changing data. Power BI Report Builder does not support some data sources. First, make a Power BI Desktop model. Send it to the Power BI service. Then, your paginated reports can link to that model. Mix data from many sources. Use Lookup if sources are native. A Power BI Desktop model is often better. It is better for mixing data. Keep data sources, gateways, and Power BI capacity close. This makes things faster. When you make paginated reports, make your queries fast.
Design Report Layouts
Design your report layout with care. Think about questions. What does your report answer? Pick data pictures. They should be easy to understand. Test how it looks when you export it. Do this early. Different ways to export have different features. Build complex layouts step by step. Use rectangles as boxes. This organizes report items. It helps how they show up. You can hide or show things. This makes reports less messy. Users can turn things on or off. This helps you make clear reports. They will be good.
Use Expressions and Parameters
Expressions and parameters make your paginated reports flexible. Expressions show changing content. You can show data fields like [Sales]. You can include page numbers [&PageNumber]. Expressions set groups for data areas. They filter data. They do this based on rules. You can pick how to sort. You can link query settings to report settings. Harder expressions let you do math. They put text together with changing data. They change how things look. For example, change text color. Do this based on a number. This makes your power bi paginated reports strong. They can change easily.
Deploying and Managing Paginated Reports
You build your paginated reports. Now you need to share them. This section shows you how to publish and manage your reports. You will learn about viewing options. You will also learn about export formats.
Publishing to Power BI Service
You can publish and share paginated reports in your workspace. This workspace must be in a Power BI Premium capacity. If you have a Premium Per User license, you can convert any workspace to a Premium workspace. Publishing a paginated report to the Power BI Service requires a Premium or Premium per User license.
Follow these steps to publish your report:
Go to File > Publish > Power BI Service.
Choose a Premium Workspace. Look for the diamond icon.
Give your report a clear name.
Click Save.
Check that your report is now available at the Power BI web site app.powerbi.com.
You might need to create a new workspace first. In the Power BI Service nav pane, select Workspaces > Create workspace. Name your workspace. For example, use “Azure AW”. In your new workspace, select Upload > Browse. Find your saved file. Select Open. If you get an error, you might need to reenter your credentials. Select the ellipses next to the report. Then choose Manage. Select Edit credentials. Enter the credentials you used in Azure. Now you can view your paginated report in the Power BI Service.
Viewing and Interaction
The Power BI Service offers different ways to view your paginated reports. The default view is interactive. This is called Web Layout. It is an HTML-based view. You can change parameter values in this view.
You can also use Print Layout. This view is for fixed page formats. It looks like a printed report. It is also like a PDF export. You can change parameter values here. However, it does not have interactive features. You cannot sort columns. You cannot use toggles. It supports browser PDF viewer features like zoom.
To switch to Print Layout:
Open the paginated report. It starts in the interactive view. Select parameters before viewing.
On the toolbar, select View > Print Layout.
To change page settings for Print Layout, select Page Settings from the View menu. You can adjust page size and orientation.
To go back to the interactive view, select Web Layout from the View dropdown box.
Exporting Formats
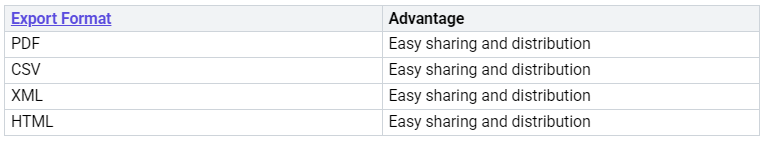
The Power BI Service allows you to export your paginated reports in various formats. This gives you flexibility. You can choose the best format for your needs. You can export to PDF for easy sharing. You can export to Excel for data analysis. The Power BI Service handles these exports efficiently.
Key Considerations and Limitations
You need to know the good and bad parts of paginated reports. This helps you pick the right tool. It helps for your reports.
When to Choose Paginated Reports
Pick paginated reports for certain jobs. They are great for printing. They are great for making PDFs. They handle data that fills many pages. You can mix data from different places. There are no limits on datasets. These reports are good for many formats. These include Excel, Word, and PDF. You get exact layouts. They are called ‘pixel perfect.’ This means exact size and spot. You can make layouts that change. Use VB.NET expressions for this. Paginated reports let you click things. You can hide or show parts. You can sort things. You can change layouts for certain users. You can filter data. You can set default values. You can write your own queries. You can use stored procedures. You can also use static data for demos. Paginated reports let you change parameters. This is for filtering. It is for ‘what-if’ ideas. You can show pictures from data. You can write your own VB.NET code. You can put other paginated reports inside. They show text well if it is HTML.
Export Format Challenges
You will find problems when you export paginated reports. Report costs for billing change. They change based on the format. Excel and CSV costs are based on size. PDF costs are based on pages and size. This makes costs different. When you export to Excel, each table goes to a new sheet. If you export to CSV, each table goes to a new file. You might see an extra row in Excel. This happens with matrix visuals. It is a copy of the first row. It is at the bottom of each group. This happens because of how pages work. It happens because of layout settings. Merged cells are common in Excel. This happens even if the PDF looks fine. Items not lined up cause merged cells. Also, wrong unit changes cause them. To fix merged cells, line up all items. Make sure widths are the same. Use whole numbers for all sizes. This helps avoid mistakes.
Performance and Refresh
Subreports can make things very slow. They run the same queries many times. One subreport run 25 times can slow things down. Bad queries in subreports cause problems. Missing indexes cause problems. Poorly written queries cause problems. You should make queries faster. Make them run once. Save the results. Use one report with filters. Do not use many subreports. Use shared data with caching. Paginated reports do not update by themselves. If you leave a report open, you see old data. You must run the report again. This gets new data. Not enough memory can stop updates. Big paginated reports can fail. This happens if they have too much data. It is due to not enough memory.
Visuals and Embedding
Paginated reports have limits on visuals. This is compared to Power BI Desktop. You cannot use fields from calculation groups. You cannot use them as parameters. This is in the paginated report visual. This is inside Power BI Desktop. Fields from calculated tables also cannot be used. They cannot be used as parameters. The paginated report visual might not work. This happens if tables are not directly linked. This is a rule in Power BI Desktop. But, you can put paginated reports inside Power BI Desktop reports. This mixes the exact output of paginated reports. It mixes it with the interactive visuals. This is from Power BI Desktop. You can send parameters between them. This makes a strong solution. It is all in the Power BI service.
Paginated reports make things look neat. They work with lots of data. You can control how they look. This makes them good for printing. You need them for bills. You need them for invoices. You need them for rules. These are important jobs. Learn about paginated reports. Make your Power BI tools better. Power BI keeps getting new things. Use all its parts.
FAQ
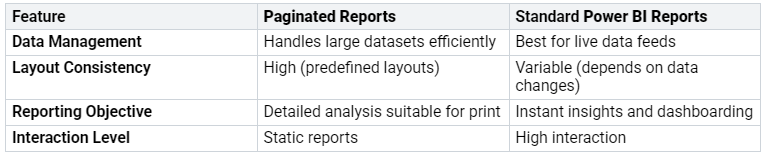
What is the main difference between standard and paginated reports?
Standard Power BI reports show interactive dashboards. You use them to look at data. Paginated reports make perfect, print-ready papers. You use them for things like bills.
When should I choose a paginated report over a standard Power BI report?
Pick paginated reports for exact printing. Use them for papers with many pages. They work well with big data. You need them for bills or rules.
How do I enable HTML markup for expressions in paginated reports?
Select your expression. Or select an object. Do this inside the text box. Right-click it. Go to Placeholder Properties. Then, pick HTML. It is under Markup type. This reads your HTML.
Can I embed paginated reports within Power BI Desktop reports?
Yes, you can embed paginated reports. This mixes perfect output. It mixes with interactive pictures. You send settings between them. This makes a strong, linked answer.
Do paginated reports auto-refresh with new data?
No, paginated reports do not auto-refresh. You must run the report again. This shows the newest data. If you leave a report open, you see old facts.
