

In data analytics, speed is important. Recent numbers show the benefits of quick query performance. For instance, Dremio changed its daily ETL process. It went from taking 30-40 minutes to only 40 seconds. This is a huge 60 times better. Faster query speeds help with real-time analytics. This lets you make choices using the latest data. With new lakehouse designs, you can get operational data fast. This removes delays in getting useful insights.
Key Takeaways
Fast query speeds are very important for quick insights. They help people make decisions fast and allow businesses to change as needed.
Using clustering keys and data compression can lower costs in cloud-based lakehouse analytics a lot.
Check query performance often to find slow queries. This helps you use resources better and makes things work faster.
Use query-driven partitioning to organize data well. This can make query speed better by up to 90% and cut down on extra data scans.
Use ongoing cost management plans to keep your analytics processes efficient and in line with business goals.
Query Speed Insights
Importance of Query Speed
In lakehouse analytics, query speed is very important. Fast queries help you access data easily. This is key for getting insights on time. When you can get data quickly, you can make smart choices faster. This quickness is needed as business needs change. You need flexible query performance to keep up with new demands.
Think about these points on why query speed matters:
Changing business needs require flexible query performance.
Different analytical tasks need speed and efficiency.
Slow query speeds can slow down decision-making. A survey showed that 71% of people wished they made decisions faster. Delays can cause problems in operations, make employees less engaged, and upset customers. Rupert Morrison, CEO at Orgvue, said that trusting your gut during slow decisions can cost money.
Factors Affecting Performance
Many technical factors greatly affect query performance in lakehouse systems. Knowing these factors can help you improve your system for better results. Here are some important things to think about:
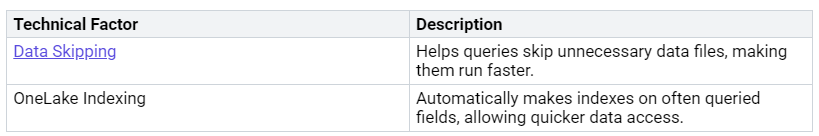
Watching query performance helps find slow queries and issues. You should test performance with data that looks like real use to get good results. Think about things like volume and data skew for better performance understanding.
By organizing data to match query patterns and cutting down on small files, you can make sure queries run fast and save money. This improvement is important as datasets grow and analytical needs change.
Cost Control in Lakehouse Architecture
Controlling costs is very important in lakehouse architecture. You must manage your expenses well to get the most from your analytics investments. Here are some tips to help you budget for analytics and find out what causes costs.
Budgeting for Analytics
When planning your budget for cloud-based lakehouse analytics, think about these tips:
Implement Clustering Keys: Use clustering keys to make queries faster. This helps reduce the data scanned, which saves money over time.
Employ Data Compression Techniques: Data compression cuts down on storage needs. This helps you save on storage and processing costs.
Adopt FinOps Practices: FinOps improves how finance, IT, and business work together. It raises cost awareness for everyone in the organization. Resources are planned, watched, and managed flexibly in cloud settings.
To use your budget wisely, follow these steps:
Know how overhead costs for cloud services are shared among departments.
Use detailed billing reports to track how resources are used.
Make smart financial choices based on real costs.
By using these tips, you can make sure your analytics budget matches your organization’s goals.
Identifying Cost Drivers
Knowing the common cost drivers in lakehouse analytics is key for managing costs well. Here are some important drivers to think about:
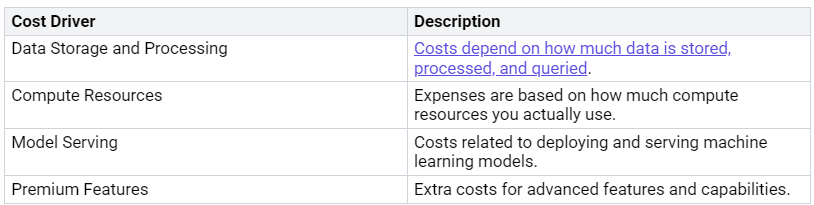
You should also know that more data can lead to higher storage and processing costs. Competing high-priority projects can raise costs because of resource use. Also, poor data management can cause extra costs from data duplication and waste.
To manage costs well, think about these strategies:
By knowing these cost drivers and using good strategies, you can improve cost management in your lakehouse architecture.
Optimizing Lakehouse Performance
Making performance better in a lakehouse setting involves three important parts: query-driven partitioning, active cache management, and Delta file health. Each part is key to improving query speed and lowering costs. Let’s look at these areas closely.
Query-Driven Partitioning
Query-driven partitioning helps you arrange your data based on how you search for it. This way, you can skip unnecessary parts during searches, which makes processing faster. Here are some steps to use effective partitioning:
Design Partitions to Match Filters: Make partitions based on common filters, like
WHERE date=.... This helps your system skip unneeded data during searches.Use Low to Medium Cardinality Columns: Pick columns that are often used in filters. Stay away from high cardinality keys to avoid too many small partitions and high metadata costs.
Implement Time-Based Partitioning: For time-related data, partition by time columns like
Year,Month, orDay. This helps with queries that need time-based calculations or filtering.Select Keys that Align with Query Patterns: Organize your partitions in a way that makes them easy to navigate. Avoid having too many small partitions, which can create metadata issues.
By following these steps, you can greatly improve query performance. Data partitioning can boost query speed by up to 90% and cut down scan times, making your analytics work better.
Active Cache Management
Active cache management is important for lowering query wait times and using fewer resources. By managing your cache well, you can make sure that often-used data is easy to access. Here are some ways to improve your cache:
Identify Frequently Accessed Data: Keep track of your queries to see which data is used the most. This helps you decide what to cache first.
Use REST API for Pre-Warming: Pre-warm your cache by using REST APIs to load data that is often needed before it is requested.
Implement Scheduled Cache Refreshes: Regularly update your cache to keep it filled with the latest information.
Leverage Incremental Refresh: Instead of refreshing the whole cache, only update the parts that have changed. This saves time and resources.
Adopt a Smart Eviction Policy: Use a policy that keeps frequently accessed data while managing less important data well.
By using these strategies, you can lower query wait times and boost overall system performance. Caching often-used data allows for quicker access, greatly cutting down the time for queries.
Delta File Health
Keeping Delta file health in good shape is key for the best lakehouse performance. Bad file health can cause longer wait times and higher resource use. Here are some steps to improve Delta file health:
Run
VACUUMRegularly: This command helps manage storage costs by getting rid of old files. Regular upkeep keeps your storage clean and efficient.Evaluate Table Optimization Techniques: Use methods like OPTIMIZE, Z-SKPPING, and liquid clustering to improve user experience and performance.
Understand Delta Lake’s Transaction Log: Learn about the transaction log to use better maintenance practices.
Build a Roadmap for Remediation: Create a plan with clear steps, timelines, and responsibilities for improving Delta file health.
By focusing on these areas, you can keep your lakehouse efficient and responsive. Watching key performance indicators (KPIs) related to Delta file health can help you spot problems before they affect performance.
Watching and Improving for Efficiency
Watching how well your lakehouse analytics work is very important. By checking how your queries run, you can find problems and areas to fix quickly. This way, you can make smart choices that improve both speed and costs.
Tools for Watching Performance
You can use different tools to watch performance well. These tools help you see important numbers and find problems before they get worse. Here’s a table showing common types of analysis used in lakehouse analytics:
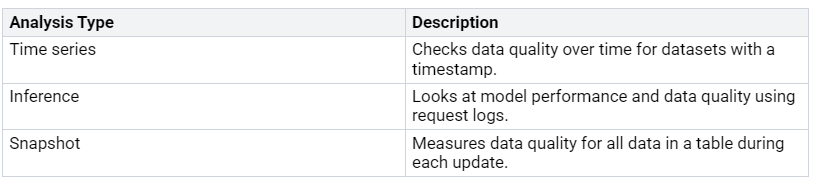
These tools give you information about how queries run and help you find issues. For example, metrics like query profiles show long-running queries and how much resources they use. Stage-level insights reveal which parts use the most resources, helping you focus on improvements.
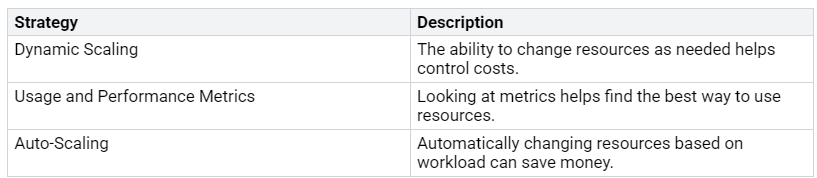
Ongoing Cost Management Strategies
Using ongoing strategies for cost management can greatly improve your lakehouse’s ability to grow. Here’s a table with effective strategies:
By using these strategies, you can keep improving your analytics processes. This ongoing approach helps you manage costs and boosts the overall performance of your lakehouse.
Real-World Applications and Case Studies
Success Stories
Many companies have improved their query speeds in lakehouse analytics. Here are some examples:
Memed: This healthcare analytics company used Dremio for real-time analytics. They cut their daily ETL process from 30-40 minutes to about 40 seconds. This change gave healthcare professionals near real-time insights.
Robinhood: They used Apache Hudi for incremental processing. This method helped them get real-time analytics while keeping strict SLAs for data freshness and compliance.
Datto: By switching to Apache Iceberg and Starburst Trino, Datto saw a 2-3x drop in query response times. They arranged their data into columnar formats and improved query execution.
Tencent Games: This gaming giant moved to an Iceberg-based lakehouse with StarRocks. They got sub-second query latency at petabyte scale while cutting storage costs.
These success stories show how effective lakehouse architecture can improve query performance.
Lessons Learned
Organizations learned important lessons from their cost control efforts in lakehouse analytics. Here are the key takeaways:
Make sure your lakehouse can grow to meet increasing and complex data needs.
Base costs on what you actually use. This allows flexibility in resource use.
A scalable platform is needed to handle different workloads well.
Good cost control helps organizations stay within budget, which is important for cloud services.
Regularly check and improve processes based on feedback and performance metrics.
Use new technologies and best practices to keep up with changing business needs.
These lessons highlight the need for smart planning and ongoing improvement in managing costs effectively.
In short, making query speed better and controlling costs in lakehouse analytics is very important for your success. New updates show that features like Warp Speed can make performance 3 to 5 times better. You should use monitoring tools to check how resources are used and find ways to save money.
To improve your plans, think about these steps:
Check your data workflows to find slow or unreliable spots.
Focus on use cases where speed and trust are most important.
Get your teams involved early to agree on priorities.
By using these lessons, you can make your lakehouse analytics better and achieve better business results.
“Using an open table format removed barriers between data tools and made reliability better.”
Use these strategies to keep your analytics efficient and effective.
FAQ
What is a lakehouse architecture?
A lakehouse architecture mixes the good parts of data lakes and data warehouses. It lets you keep a lot of data while giving quick access for analysis. This setup works well with different types of data and analytics tasks.
How can I improve query speed?
You can make query speed better by using query-driven partitioning, managing your cache actively, and keeping Delta files healthy. These methods help make data access easier and cut down on unnecessary scans, which leads to faster queries.
What are common cost drivers in lakehouse analytics?
Common cost drivers are data storage and processing, compute resources, model serving, and premium features. Knowing these drivers helps you control costs better and manage your analytics budget wisely.
How often should I monitor performance?
You should check performance regularly, about once a week or month. This habit helps you spot slow queries and see how resources are used, so you can make quick changes for better efficiency.
What tools can I use for performance monitoring?
You can use different tools for performance monitoring, like query profiling tools, data quality dashboards, and cloud service monitoring solutions. These tools give you information about query performance and help you find areas to improve.
