

In today’s busy business world, you need to focus on improving Power BI performance. Good performance helps you make smart decisions quickly. When reports load fast and work well, you can believe the information they give. This belief creates a culture of using data to make decisions in your company. By working on bettering Power BI performance, you help your team reach their goals more easily.
Key Takeaways
Making Power BI work better helps reports load faster. This allows for quicker decisions and better understanding.
Common problems include big datasets, tricky DAX formulas, and too many visuals on one page. Finding these issues can help make things work better.
Good ways to improve performance are using a star schema, reducing visuals, and making DAX calculations simpler to speed up reports.
Checking performance often with tools like the Performance Analyzer helps find slow queries and makes the user experience better.
Spending time on Power BI optimization not only improves reporting but also helps businesses succeed by encouraging a data-focused culture.
Why Optimize Performance?
Making Power BI performance better is very important for your business success. When reports load fast, you can make decisions quickly. This speed gives you better insights and leads to good results. Here are some main reasons why performance is important:
Focused Attention: Single-metric views help you cut out distractions. This focus boosts performance and helps you analyze data better.
Predictive Capabilities: With advanced analytics, you can see future trends. This ability helps you make smart decisions that fit your business plan.
Real-Time Collaboration: Power BI lets teams work together easily. Quick decisions become possible, making sure everyone stays on track with business goals.
Big companies like IBM, Mayo Clinic, and Walmart use Power BI to change how they work. Their success shows how good performance optimization can lead to business success. Custom dashboards help departments check their progress toward goals, improving performance tracking.
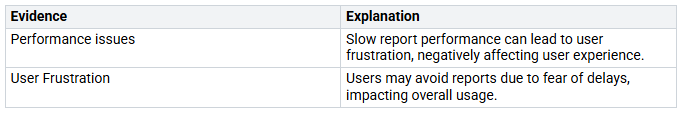
Speed is also very important for user adoption. Recent studies show that slow report performance can make users frustrated. If each query takes a long time, users might not want to use the report. This hesitation can waste time and lower engagement.
Common Causes of Slow Performance
Slow performance in Power BI usually comes from a few main problems. Knowing these issues can help you improve your reports and dashboards.
Data Model Issues
Data models are very important for Power BI performance. If you bring in large, unoptimized datasets, you might see big delays. For example, importing millions of rows without grouping them can slow things down. Here are some common data model problems that can hurt performance:
Large, unoptimized datasets
Poor data modeling practices
Inefficient refresh schedules
As your data models get more complicated, they need more computing power. This complexity can cause longer processing times and slower responses. For instance, if you don’t have proper relationships or have extra columns, your reports may load slowly. You can speed things up by using a star schema and improving your DAX calculations.
Complex DAX Formulas
Complicated DAX formulas can also slow down performance. When you use complex calculations, you put more load on Power BI. Here are some common issues with complex DAX:
Nested iterators that slow down performance
Measures that take up a lot of total DAX query time
Row-by-row calculations that can be avoided
To boost performance, try these best practices:
Use measures instead of calculated columns to keep your model size small.
Use variables in DAX for better clarity and performance.
Avoid unnecessary recalculations by not forcing zero values in measures with no data.
By making your DAX formulas simpler, you can shorten query times and improve overall performance. Remember, complex expressions can put stress on the Formula Engine, leading to longer execution times.
Overloaded Visuals
Too many visuals can really hurt how fast your Power BI dashboards respond. Each visual on a report page adds to loading times. If you have too many charts, slicers, or tables on one page, you might notice delays. Studies show that dashboards taking ten seconds or more to load are often seen as broken, no matter how rich their data is. Here are some things to think about:
A slow dashboard can show inefficiency and hurt user trust.
Many visuals can overload Premium capacities and lower reporting effectiveness.
Avoid bi-directional cross-filtering relationships unless needed, as they can slow down performance.
To improve performance, limit the number of visuals per page and focus on the most important data points. Simplifying your visuals not only speeds up loading times but also makes the user experience better.
Power BI Performance Best Practices
To get the best performance in Power BI, you need to follow some best practices. These practices help you improve data sources, keep a clear data model, and make DAX calculations better. Using these tips will make your reports faster and more reliable.
Optimize Data Sources
Improving your data sources is very important for better Power BI performance. Here are some good strategies:
Limit the number of visuals in dashboards and reports. Fewer visuals mean faster loading times.
Use the on-premises data gateway in standard mode. This way, you avoid problems that can happen with personal mode.
Set up separate gateways for live connections and scheduled data refreshes. This keeps things running smoothly.
Use calculated measures and filters to reduce complex measures in your data models. This helps cut down processing time.
Push calculations to the source when you can. This reduces the load on Power BI.
Use a star schema instead of a snowflake schema. Star schemas make relationships easier and improve query speed.
Use slicers carefully. Too many slicers can slow things down.
Host reports and data sources in the same area. This setup speeds up data retrieval.
Split large datasets and process them in parallel. This method improves refresh times and overall performance.
By using these strategies, you can make your data sources work better, leading to faster report creation and a better experience for users.
Data Model Discipline
Keeping your data model organized is key for the best Power BI performance. Here are some ways to improve your data model:
Enhanced Model Scalability: Organize your data model with a clear structure. This keeps your model easy to manage and avoids confusion.
Streamlined Documentation and Governance: Keep your DAX logic in one place. This makes it easier to document and understand across teams.
Adjust Default Field Summarization: Change how non-quantitative fields summarize. This keeps data accurate and improves reporting.
Refine the Model View Layout: A neat layout in the Model View speeds up development and makes it easier to use.
Use Descriptive Naming and Folders: Clear names and organized folders help users and prepare your model for advanced analytics.
By using these techniques, you can create a more efficient and manageable data model. This organization will lead to faster query performance and a better experience for users.
DAX Optimization Techniques
Making your DAX formulas better is important for reducing query times and improving Power BI performance. Here are some good DAX optimization techniques:
Optimize DAX Functions: Learn which DAX functions work best for your data.
Minimize Row Context Transitions: Use functions like CALCULATE and FILTER wisely. Avoid unnecessary context changes to boost performance.
Use the Performance Analyzer Tool: This tool helps you find performance problems in your reports by checking how long visuals and queries take.
Leverage Query Diagnostics: Look at the time spent on different data processing stages to find slow spots.
Reduce Model Size by Dropping Unused Data: Review datasets to remove rarely used tables and columns. This helps improve refresh times.
Use Aggregations: Create summary tables to make performance better by reducing large amounts of data.
Limit the Number of Visuals on a Page: Too many visuals can slow down response times. Focus on important insights instead.
Optimize Visuals: Choose simpler visuals for better performance.
Stay Up to Date with Power BI Enhancements: Keep learning about new features that can help performance.
By using these DAX optimization techniques, you can greatly reduce query times and improve the overall performance of your Power BI reports.
Tools for Monitoring Power BI Performance
Keeping an eye on how well your Power BI reports work is very important. There are many tools that can help you find problems and make your reports better.
Performance Analyzer
The Performance Analyzer is a strong tool that gives you real-time information about your report’s performance. It helps you find problems in report parts. Here are some main benefits of using this tool:
It shows how long different report parts take to load.
It finds which visuals or queries cause delays.
You can focus on fixing issues based on what it shows.
This tool is especially helpful for big datasets and complex visuals. It points out slow DAX queries and too many visuals, helping you see how each part affects loading time. By using the Performance Analyzer, you can greatly improve your Power BI performance.
User Defined Aggregations
User Defined Aggregations let you make custom summaries for your data models. This feature helps make queries faster by reducing the data processed during analysis. You can set up summaries based on what you need for reporting, making data retrieval easier.
For example, if you often look at sales data, you can create a summary that shows sales by region or product type. This method cuts down on the data scanned during queries, leading to quicker report loading times. By using User Defined Aggregations, you can make your Power BI reports work better.
Hybrid Tables
Hybrid Tables mix Import and DirectQuery modes, which helps improve query performance. They let you keep only the most important data, called the ‘hottest’ data, in DirectQuery mode. This greatly reduces the amount of data scanned during queries.
Also, setting up incremental refresh for new data allows queries to come from cache memory, making performance even better. By using Hybrid Tables, you can optimize your Power BI performance in large data situations.
Real-World Applications of Optimization
Case Studies
Many businesses have improved a lot after making their Power BI performance better. Here are some important case studies that show these successes:
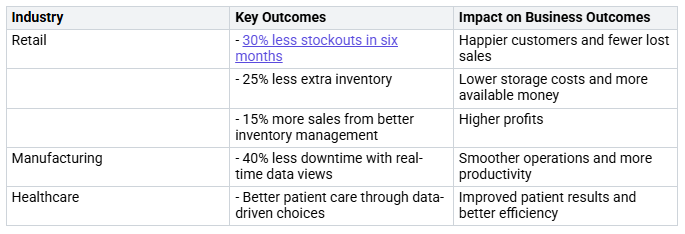
These examples show how good performance optimization can bring real benefits. By focusing on managing data and visuals, companies can improve their work and get better results.
Industry-Specific Examples
Different industries gain special benefits from optimizing Power BI performance. Here are some specific numbers and advantages in various fields:
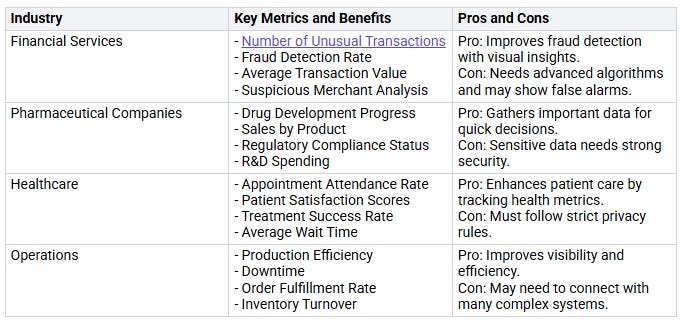
These examples show how Power BI optimization can lead to better metrics and overall performance. By customizing solutions for each industry, organizations can make the most of their data and achieve better business results.
By understanding these real-world applications, you can see why investing in Power BI performance optimization is valuable. It not only improves your reporting but also helps your organization reach its goals.
Improving Power BI performance is not just a one-time job. You should think of it as something you do all the time. Keeping it up helps you stay ahead of others. Here are some important benefits of good optimization:
Power BI makes data look better and easier to understand.
It allows for real-time reporting, so you can make quick decisions with correct data.
Custom dashboards help your teams work together and share knowledge.
Looking at key metrics helps you find ways to improve and new chances.
By focusing on performance optimization, you help your organization succeed in a world driven by data. 🌟
FAQ
What is Power BI performance optimization?
Power BI performance optimization means making reports and dashboards faster and better. You do this by improving data models, making DAX formulas simpler, and managing visuals well.
Why is performance important in Power BI?
Good performance in Power BI builds user trust and encourages use. Fast reports help you make decisions quickly. This way, you can use insights effectively for business success.
How can I monitor Power BI performance?
You can use tools like the Performance Analyzer and Query Diagnostics. These tools help you find slow queries and visuals. This lets you make changes for better performance.
What are some common performance issues?
Common problems include large datasets, complex DAX formulas, and too many visuals. These things can slow down report loading times and hurt user experience.
How often should I optimize my Power BI reports?
You should check and improve your Power BI reports regularly. Continuous optimization keeps your reports efficient, especially as data grows and user needs increase.
