

In today’s digital world, you need data to make decisions. It helps improve results. Office 365 has strong tools for your data. By using Enterprise-Scale Analytics, you can change raw data into useful information. This smart way to use data helps you work better. It also improves processes and keeps you following rules. In the end, using analytics helps you make smart choices. This will help your organization grow.
Key Takeaways
Data silos make it hard to analyze information. Break these down to help teamwork and get better insights.
Use enterprise-scale analytics to change raw data into useful insights. This helps make smarter decisions and boosts efficiency.
Create a strong data governance plan. This keeps data safe, follows rules, and ensures high-quality information for your organization.
Use tools like Microsoft Graph Data Connect and Power BI for easy data integration and visualization. These tools improve teamwork and make reporting easier.
Take a proactive approach to data analytics. This helps your organization stay competitive, improve security, and support responsible AI use.
Barriers to Analytics
Data Silos
Data silos are a big problem for organizations that want to use analytics well. When different departments keep their data separate, it makes it hard to combine and understand the information. If you make decisions based on only part of the data, you might miss important details. This can lead to wrong conclusions that stop your organization from making smart choices.
Think about these effects of data silos:
Employees waste about 5.3 hours each week waiting for data from coworkers.
Lost productivity costs U.S. businesses nearly $1.8 trillion every year.
A survey showed that 81% of IT leaders think data silos slow down digital changes.
With 40% of organizations saying data silos are a big problem, it’s important to fix this. By breaking down these silos, you can improve teamwork and get better insights from your data.
Complexity in Reporting
Complex reporting can also slow down your analytics projects. Organizations often deal with issues like buying problems, charging issues, and not seeing how licenses are used. These things can make reporting confusing and hard to get useful insights.
Here are some common problems you might face:
Combining services like Exchange, SharePoint, and Teams can cause confusion.
Managing a hybrid cloud setup adds more complexity that needs careful planning.
Finding unknown problems in hybrid setups can slow down progress.
To handle these issues, you should focus on making data easier to access and improving visibility in your organization. This will help you create a smoother reporting process that supports your analytics goals.
Governance Challenges
Good governance is key for managing analytics in Office 365. Without a strong governance plan, organizations face many problems that can hurt their analytics work. For example, as more users join, scalability issues can cause data spread and inconsistencies.
Think about these governance challenges:
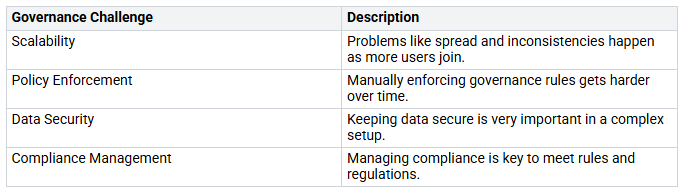
Weak data governance can cause operational problems, money loss, and harm to your reputation. It’s important to have a clear data governance plan to reduce these risks. By doing this, you can make sure your data stays a valuable resource that helps your business succeed.
Strategies to Turn Data into Insights
Embracing Enterprise-Scale Analytics
To get the most from your data, you need to use enterprise-scale analytics. This method helps change raw data into useful insights on a large scale. By combining different data sources, you can see a complete picture of your organization. Here are some important benefits of using enterprise-scale analytics:
Improved Decision-Making: You can make smart choices based on complete data insights.
Increased Efficiency: Making data processes easier saves time on data management.
Enhanced Collaboration: Working together is easier with shared analytics.
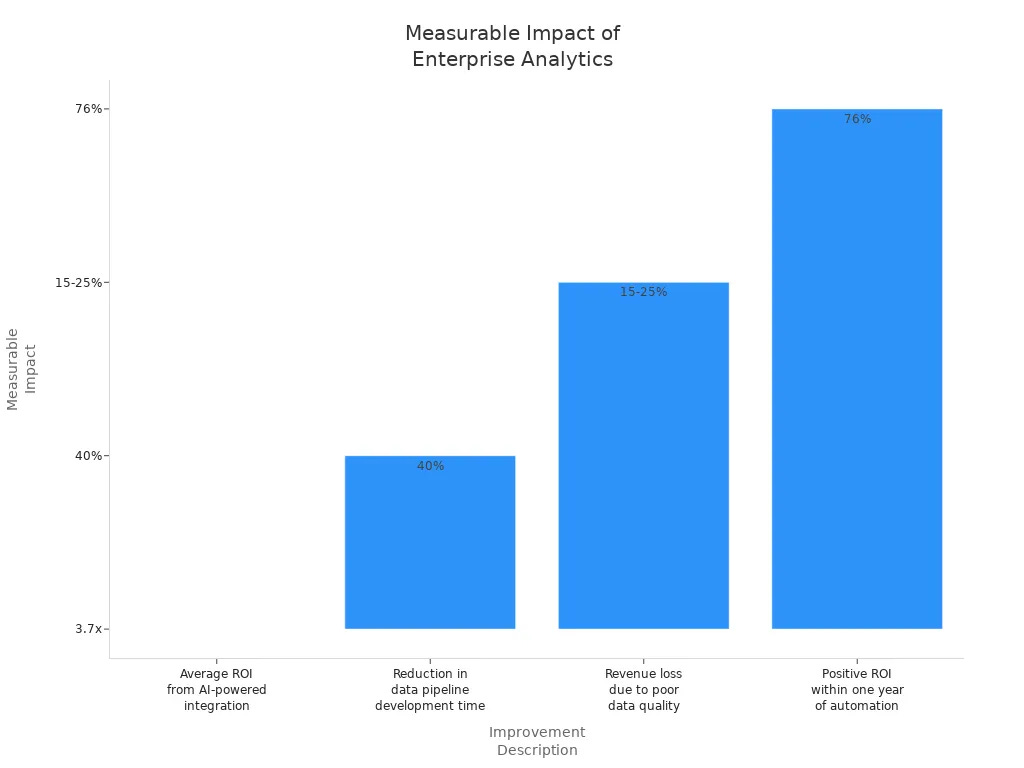
Organizations that use enterprise-scale analytics often notice real improvements. For example, they see an average ROI from AI-powered integration of 3.7x and a 40% drop in data pipeline development time. The table below shows some of these improvements:
Building an Intelligence Driven Organization
Making an intelligence-driven organization is key to getting the most from analytics. This culture supports data-based decision-making and helps employees use insights well. Here are the main traits of such an organization:
Enhanced Productivity: Looking at work patterns to improve processes.
Informed Decision Making: Using data insights for smart choices.
Employee Engagement: Better management through understanding teamwork.
Resource Optimization: Clear information on how resources are used.
Innovation and Adaptation: Helping organizations respond to market changes.
To create this culture, focus on some important changes. First, encourage a data-driven culture that supports trying new things and learning all the time. This can lead to productivity and revenue growth increases of 20-30%. Also, invest in training programs to boost employee data skills. Companies like Microsoft and IBM provide resources to help with this.
Utilizing Microsoft Graph Data Connect
Microsoft Graph Data Connect is a strong tool that helps with large-scale data integration for analytics in Office 365. This tool lets you easily combine data from Microsoft 365 into Azure Synapse Analytics. By doing this, you can do advanced analytics and learn about collaboration patterns, productivity, and security. Here are some key features of Microsoft Graph Data Connect:
Gives secure and scalable access to Microsoft 365 datasets.
Speeds up time to insights by cutting down data processing time.
Supports many analytics scenarios, like customer relationship and business process analytics.
Common use cases for Microsoft Graph Data Connect include:
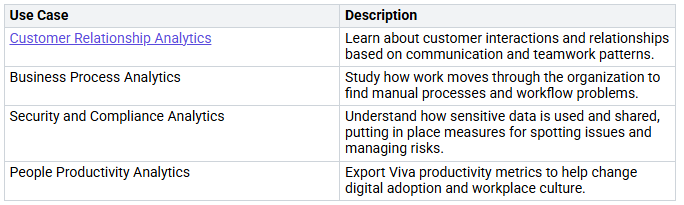
By using Microsoft Graph Data Connect, you can build a unified analytics platform that turns your data into useful insights. This integration is important for driving digital change and achieving flexibility in your organization.
Using Microsoft Tools for Analytics
Power BI for Visualization
Power BI is a great tool for showing data. It helps you change complicated data into simple, interactive dashboards and reports. With Power BI, sharing insights across your organization is easy. Here are some important features that make Power BI good for large-scale data visualization:
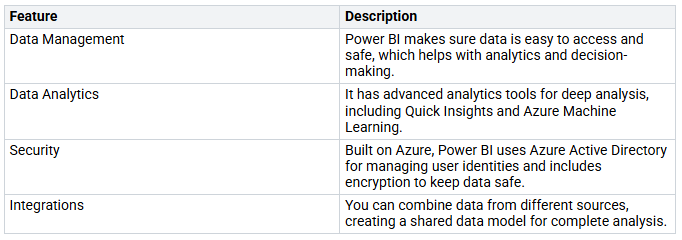
Using Power BI can make reporting more efficient. Its easy design helps you learn quickly, allowing faster report creation and better decision-making.
Azure for Advanced Analytics
Azure boosts your analytics skills by giving you advanced tools for data processing and machine learning. It helps you get useful insights fast, which supports quicker strategic decisions. Here are some features of Azure that help with advanced analytics:
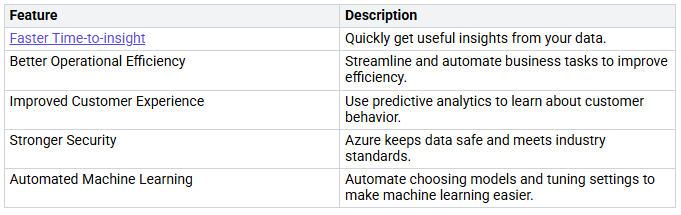
By connecting Azure with Office 365, you can use many advanced analytics options. For example, you can get real-time insights through Stream Analytics and improve data streams with machine learning models.
Automating Reporting Workflows
Automating reporting workflows in Office 365 analytics changes how you access and use data. Automation cuts down the time spent on manual reporting tasks, letting your teams focus on analysis. Here are some benefits of automating reporting workflows:
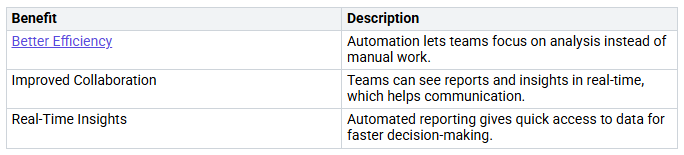
With tools like CoreView Configuration Manager and AdminDroid, you can automate reporting well. This leads to data-driven insights that change decision-making. By turning complex data into easy-to-understand visuals, you improve clarity and help respond faster to business challenges.
Using data analytics helps you stay ahead in today’s fast market. If you take a proactive approach to using data, you can gain many benefits. For example, companies that use Office 365 analytics often make more money, target customers better, and work more efficiently.
Think about these long-term effects of being proactive:
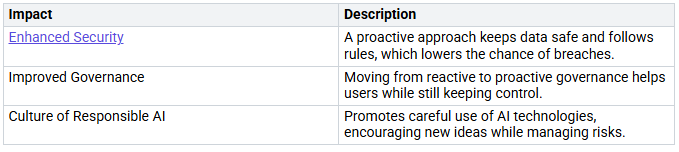
By adding Office 365 analytics to your work, you can change your organization into a data-driven leader. This digital change will help you make better decisions and improve results everywhere.
FAQ
What is enterprise-scale analytics?
Enterprise-scale analytics means looking at a lot of data in a company. It helps you find useful information that leads to better choices and makes things work better.
How can I break down data silos?
You can break down data silos by bringing together data from different departments into one place. Use tools like Microsoft Graph Data Connect to make data easier to access and improve teamwork.
Why is data governance important?
Data governance makes sure your data is safe, follows rules, and is trustworthy. It helps you keep data quality high and control who can see it, lowering the chances of data leaks and rule-breaking.
How does Power BI enhance data visualization?
Power BI changes complicated data into easy-to-understand dashboards and reports. It helps you share insights quickly, making it easier for your team to understand and use the data.
What role does Azure play in advanced analytics?
Azure gives you strong tools for processing data and using machine learning. It helps you get useful insights fast, which helps you make quicker smart decisions in your organization.
